
KEY TAKEAWAYS
- Companies continue to buy back their own shares at a near record pace.
- We do not see buybacks as an indication that corporate management teams are less optimistic about the future.
- Underlying core earnings power remains strong and corporate balance sheets remain in excellent shape.
Click here to download a PDF of this report.
RESPONSE TO BUYBACK CONCERNS
Are share buybacks a problem? Share buybacks have become controversial but we do not consider them a problem. Some are concerned they come at the expense of future growth. Some argue that heavy share buyback activity might signal a lack of confidence in growth opportunities. Some worry that without them, earnings growth would be much worse. Finally, some point out that additional debt being taken on by corporations to fund buybacks may lead to credit stresses down the road. Here we discuss these topics and make the case that buybacks are not a problem for corporate America.
BACKGROUND
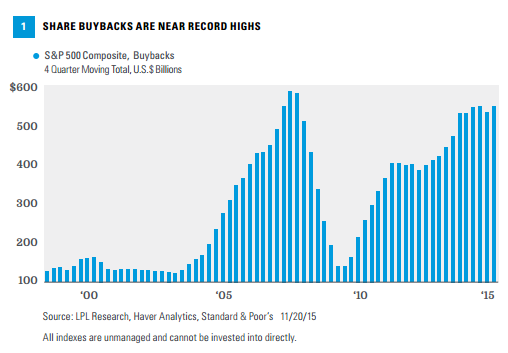
Companies continue to buy back their own shares at a near record pace. Over the past four quarters, S&P 500 companies have bought back $553 billion worth of their stock (latest data available are as of Q2 2015), just short of the record total of $589 billion during 2007 [Figure 1]. Companies buy back stock primarily for these reasons:
- Boost earnings per share by reducing share count
- Return capital to shareholders in a more tax efficient manner than paying dividends
- Maintain flexibility with capital return strategy (buybacks are easier to stop than dividends or capital spending)
These drivers help explain why companies have bought back so much stock in recent years. Management teams with compensation plans based on earnings per share have an added incentive. There are several conditions that remain in place that tell us that buybacks are likely to continue at a steady pace:
Slow growth. Economic growth has been below trend for much of the current economic expansion. Earnings have flattened out–although we do expect potential acceleration in 2016, based on better global economic growth and anticipated stabilization in oil prices and the U.S. dollar. In this environment, companies faced with decisions about how to allocate excess capital have increasingly chosen share buybacks over investing in future growth of their business or making acquisitions.
Strong balance sheets. Companies have become very efficient since the financial crisis, building up a significant cash stockpile. Cash and short-term investments for the S&P 500 (excluding the financials sector) rose 5.5% year over year to a near record $1.4 trillion as of June 30, 2015. Corporations’ impressive cash flow generation ability has left them able to buy back an increasing amount of their shares overall while still maintaining healthy capital investment levels, with the exception of the energy sector, and continuing to increase dividend payouts.
Low interest rates. Interest rates remain very low by historical standards. Credit markets remain generally healthy, providing companies with opportunities to borrow inexpensively to raise funds and buy back stock.
DO BUYBACKS COME AT THE EXPENSE OF FUTURE GROWTH?
We understand this concern. In a perfect world, companies would have so many attractive growth opportunities that they would invest in that future growth by buying equipment and building plants while keeping buybacks limited.
Certainly there are limits to the amount of cash companies have to work with, but all of the primary alternative uses of cash have been on the rise:
- Dividend payout ratios, now at 45% (S&P 500), have been steadily rising since 2011, and the dividend yield for the S&P 500, at just over 2%, is in-line with its 25-year average and at the high end of its post-financial crisis range.
- Capital spending, up until the energy capital spending downturn in the second half of 2014, had been increasing steadily since 2010. The drag on overall capital expenditures for the S&P 500 is likely several percentage points larger than the 6% drag energy has been on S&P 500 earnings during the third quarter of 2015.
- Merger and acquisition activity is booming. U.S. acquisition volume, according to data provider Dealogic, is at a record annual high of over $2.0 trillion (up 55% over 2014); while global merger volume has exceeded $4.0 trillion for the first time, and was 38% higher than 2014 year-to-date levels as of November 3, 2015.
Bottom line, companies have plenty of cash to return some to shareholders–in the form of share buybacks and dividends–while still making capital investments and acquisitions to drive growth.
NO CONFIDENCE VOTE?
We would not interpret strong share buyback activity to mean that corporate management teams have meaningfully less confidence in the economic outlook or the outlook for their businesses. First, although buybacks have ramped back up to match 2007 levels, the S&P 500 has rallied back well beyond 2007 levels. So when measured relative to the market cap of the S&P 500, share buyback activity has not changed much in the past five years (between 2% and 2.5% of market cap). And during much of that time, capital spending was increasing.
In addition, management confidence levels in their own businesses and the economy are as high as they have been since before the financial crisis, based on the Duke University CFO Survey. That same survey indicated companies expect capital spending to increase by 2.4% over the next year (through the third quarter of 2015) despite the significant, potentially double-digit percentage drag in the energy sector.
GOOD CORE EARNINGS PICTURE
Earnings may not grow at all in 2015, even with the benefit of share buybacks. Consensus estimates are calling for a meager 0.3% increase in S&P 500 earnings in 2015 compared with 2014, and that even includes an expected 2.5% or so boost from share buybacks. During the year ending June 30, 2015, S&P 500 companies repurchased 2.8% of their aggregate shares outstanding.
But the main factors that have weighed on earnings in 2015 are more than big enough to offset the impact from share buybacks. We illustrate this point in Figure 2, a waterfall chart that starts with the third quarter of 2015 year-over-year earnings growth rate (-0.8%) on the left hand side, and then adds (or subtracts) the impact from the key factors (buybacks, U.S. dollar, and energy), to get to a core earnings growth number of 5.7%, excluding the estimated impact of share buybacks, the strong U.S. dollar, and the energy sector.
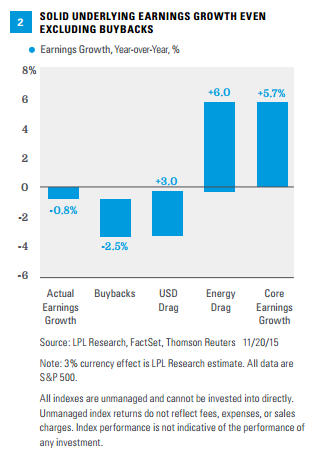
We do not necessarily think buybacks (nor energy or the U.S. dollar) should be excluded from earnings. But this exercise is helpful to assess an earnings growth rate that could be sustained. A 5-6% growth rate is not all that impressive, but at this stage of the bull market, it may be enough to drive respectable mid-single-digit gains in stocks.
ARE COMPANIES OVER-LEVERAGED?
Leverage is another concern that comes up with regard to share buybacks. Over the past 12 months, roughly 30% of buybacks have been funded at least partially with debt. Corporations have also developed a reputation for buying their shares back at inopportune times. Combined, these factors have led to concerns that many of these companies are stretching their balance sheets too far and that if their shares fall, and borrowing costs rise, this additional leverage may become difficult to manage.
A look at interest coverage (earnings before interest and taxes divided by interest expense) for the S&P 500 reveals that companies are in an excellent position to service their existing levels of debt [Figure 3]. Companies are covering their interest cost overall by roughly double the margin they were doing so in the mid-2000s. This cushion is likely enough for most companies to manage their debt loads even in the event that interest rates rise and share prices fall. In the event of a downturn, companies have other layers of defense to preserve cash besides halting share buybacks, including dividend cuts and capital spending reductions. The energy sector, with its relatively small number of defaults in 2015, is a good example of the effectiveness of these actions.

CONCLUSION
We do not see share buybacks as a problem. We would prefer to see the mix shift some more toward capital spending, but buybacks, capital spending, and dividends are not mutually exclusive. We do not see buybacks as an indication that corporate management teams are less optimistic about the future. While earnings have been disappointing in 2015 with or without buybacks, underlying core earnings power remains strong and growth is poised to accelerate in 2016 as temporary drags abate. Finally, corporate balance sheets remain in excellent shape and should be able to withstand the additional debt taken on to fund buybacks.
*Corporate bonds are considered higher risk than government bonds but normally offer a higher yield and are subject to market, interest rate, and credit risk as well as additional risks based on the quality of issuer coupon rate, price, yield, maturity, and redemption features.
IMPORTANT DISCLOSURES
The opinions voiced in this material are for general information only and are not intended to provide specific advice or recommendations for any individual. To determine which investment(s) may be appropriate for you, consult your financial advisor prior to investing. All performance referenced is historical and is no guarantee of future results.
The economic forecasts set forth in the presentation may not develop as predicted and there can be no guarantee that strategies promoted will be successful.
Investing in stock includes numerous specific risks including: the fluctuation of dividend, loss of principal, and potential liquidity of the investment in a falling market.
All investing involves risk including loss of principal.
Because of its narrow focus, specialty sector investing, such as healthcare, financials, or energy, will be subject to greater volatility than investing more broadly across many sectors and companies.
INDEX DESCRIPTIONS
The Standard & Poor’s 500 Index is a capitalization-weighted index of 500 stocks designed to measure performance of the broad domestic economy through changes in the aggregate market value of 500 stocks representing all major industries.
DEFINITIONS
Leverage is the degree to which a company uses fixed-income securities such as debt and preferred equity. The more debt financing a company uses, the higher its financial leverage.
This research material has been prepared by LPL Financial LLC.
To the extent you are receiving investment advice from a separately registered independent investment advisor, please note that LPL Financial LLC is not an affiliate of and makes no representation with respect to such entity.
Not FDIC or NCUA/NCUSIF Insured | No Bank or Credit Union Guarantee | May Lose Value | Not Guaranteed by Any Government Agency | Not a Bank/Credit Union Deposit
Tracking #1-442901 (Exp. 11/16)