
KEY TAKEAWAYS
- We continue to expect housing may add to GDP growth in 2015 and for the next several years, as the market normalizes following the severe housing bust of 2005-2010.
- Housing affordability, housing supply, home mortgages supply, and home prices may largely determine the pace at which housing adds to GDP growth in the years ahead.
- At only around 3% of GDP, housing is not large enough to carry the economy by itself.
Click here to download a PDF of this report.
IS HOUSING ENOUGH?
Economic data released in the next two weeks will shed light on the state of the housing market in late third quarter and early fourth quarter of 2015. Several key housing-related economic data releases are due this week (November 16-20, 2015) including the National Association of Homebuilders Home Builder (NAHB) Housing Market Index for November 2015 and housing starts and building permits for October 2015. Next week (November 23-27), reports on existing home sales for October 2015, the Case-Shiller Home Price Index for September 2015, and new home sales for October 2015 are due.
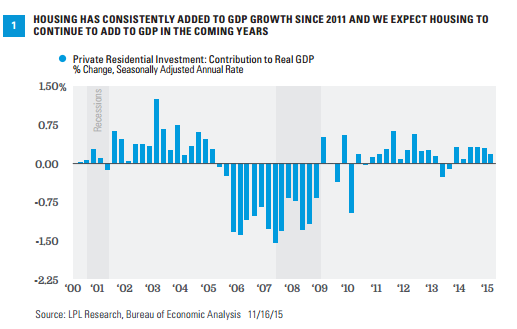
In addition, the revised figure for gross domestic product (GDP) for the third quarter of 2015 will be released on Tuesday, November 24, 2015. This report will provide an update on the impact housing had on the economy in the third quarter and in 2015 so far. The initial report on third quarter GDP (released in late October 2015) found that housing–as measured by residential fixed investment–added 0.2 percentage points to GDP growth in the third quarter after adding 0.3 percentage points in each of the first two quarters of the year [Figure 1].
With the solid performance in the first three quarters of 2015, housing has now added to GDP growth in 16 of the 18 quarters since early 2011. Prior to that, between late 2005 and late 2010, housing had been a drag on the overall economy in 17 of the 20 quarters (or five years), as the economy endured the housing-induced Great Recession and its aftermath. We continue to expect (per our long-held view) housing may add to GDP growth in 2015, 2016, and for the next several years, as the market normalizes following the severe housing bust of 2005-10, but acknowledge that housing alone cannot carry the U.S. economy.
KEY DRIVERS OF HOUSING IN 2015 AND BEYOND
Several factors will likely determine the pace at which housing adds to GDP growth in the coming years. Among them are:
Housing affordability. Housing affordability, the ability of a household with the median income to afford the payments on a median-priced house at prevailing mortgage rates, hit an all-time high in early 2013, before the big run-up in mortgage rates that began in mid-May 2013, as a result of what is now known as the “taper tantrum.” Since then–despite another sharp drop in mortgage rates since late 2013–a combination of rising home prices and sluggish income growth have driven affordability some 20% lower. Although mortgage rates have moved lower since the end of the taper tantrum, they remain 50-75 basis points (0.50-0.75%) higher than the 2013 lows that preceded the taper tantrum.
Despite the drop, affordability is well above its long-term average [Figure 2] and also well above the levels during the mid-2000s housing boom. The three components of affordability–incomes, home prices, and mortgage rates–may all continue to move higher, potentially driving affordability lower back toward its long-term average, but not much below.

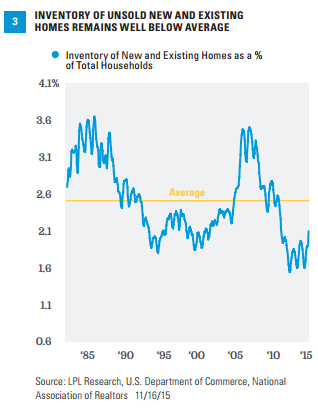
Housing supply. At just over 200,000 units, the number of new single-family homes for sale at the end of September 2015 was well below the peak of nearly 600,000 units for sale in 2006, but above recent lows (140,000-150,000 units). The number of existing single-family homes for sale (1.98 million in September 2015) is nearly 1.5 million units below the peak of 3.4 million set in mid-2007. Combined, the level of new and existing homes for sale remains well below average [Figure 3], relative to the number of households in the economy–and the low level of inventory is likely to be a big factor in driving housing construction in the coming years. We’ll get an update on both new and existing home inventories in the last full week of November.
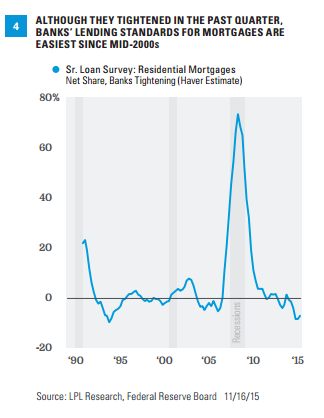
Home mortgages supply. From the mid-1990s through late 2006, bank lending standards (required down payments, credit scores, work history, etc.) for residential mortgages were relatively easy. Coupled with low rates and rapid innovation in financial products backing residential mortgages, this easy credit helped to fuel the housing boom. The banking industry began tightening lending standards in late 2006 and continued to tighten standards for more than two years. Lending standards eased in 2009 and 2010, but remained more restrictive than they were in the peak boom years from 2004-06. The latest survey (fourth quarter 2015) revealed that although bank lending standards for home mortgages tightened a bit between the third and fourth quarters of 2015, over the past four quarters they have been the easiest since mid-2006 [Figure 4]. The improvement in this indicator in recent quarters is a good sign and may help to offset the recent rise in the rates banks are charging for mortgages. The market will get an update on this metric, via the Federal Reserve’s Senior Loan Officer Survey, in early 2016.
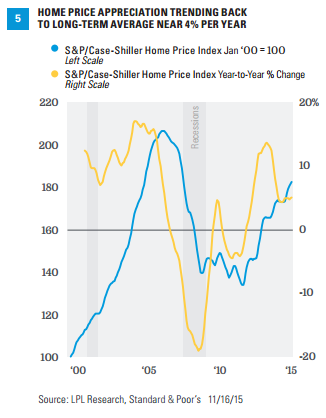
Home prices. The market will have to wait until next week (November 23-27, 2015) to get an update on home prices via the new and existing home sales reports for October 2015 and the S&P/Case-Shiller Home Price Indexes for September 2015 and the third quarter. There are various measures and sources for home prices–which, as noted above, are a component of housing affordability. In general, home prices rose rapidly (much faster than inflation or income growth) in the early 2000s, peaked in 2004-06, fell between 25 and 30% through 2009-10, and have been in recovery mode since then. The Case-Shiller Index [Figure 5] is a good proxy for home prices nationwide. It shows the big run up in prices in 2000-06, the big drop in prices from 2006-09, the sideways move in house prices in 2009-12, and more solid gains in 2013-15. On a year-over-year basis, the Case-Shiller Home Price Index has been moderating in the past two years, after peaking at an unsustainable 14% year-over-year increase in late 2013, to a more sustainable 4-5% pace over the past year. We would view price increases in that range–which is consistent with the average housing price gain in the past 35 years–as a sign that the housing market is stable, and poised to be a consistent contributor to GDP growth in the quarters and years ahead, without the boom bust cycle of the 1990s and 2000s.
CONCLUSION
We continue to expect that housing may add to economic growth in the years ahead. Although interest rates could move higher in the coming years, we expect the trends that have helped the housing market out of the housing bust to remain in place. Still, like other segments of the economy that have struggled to recover from the Great Recession, the housing recovery remains choppy and uneven.
IMPORTANT DISCLOSURES
The opinions voiced in this material are for general information only and are not intended to provide specific advice or recommendations for any individual. To determine which investment(s) may be appropriate for you, consult your financial advisor prior to investing. All performance reference is historical and is no guarantee of future results. All indexes are unmanaged and cannot be invested into directly.
The economic forecasts set forth in the presentation may not develop as predicted.
The S&P/Case-Shiller U.S. National Home Price Index measures the change in value of the U.S. residential housing market. This index tracks the growth in value of real estate by following the purchase price and resale value of homes that have undergone a minimum of two arm’s-length transactions. The index is named for its creators, Karl Case and Robert Shiller.
The Composite Housing Affordability Index is published monthly by the National Associate of Realtors and measures median household income relative to the income needed to purchase a median-priced house.
The National Association of Home Builders Housing Market Index is based on a monthly survey of NAHB members designed to take the pulse of the single-family housing market. The survey asks respondents to rate market conditions for the sale of new homes at the present time and in the next six months as well as the traffic of prospective buyers of new homes.
This research material has been prepared by LPL Financial LLC.
To the extent you are receiving investment advice from a separately registered independent investment advisor, please note that LPL Financial LLC is not an affiliate of and makes no representation with respect to such entity.
Not FDIC or NCUA/NCUSIF Insured | No Bank or Credit Union Guarantee | May Lose Value | Not Guaranteed by Any Government Agency | Not a Bank/Credit Union Deposit
RES 5295 1115| Tracking #1-440692 (Exp. 11/16)