
KEY TAKEAWAYS
- Both the pace of rate hikes and ultimate resting spot for the fed funds rate greatly influence how quickly, and by how much, yields may ultimately rise.
- We do not anticipate a repeat of the taper tantrum, which saw the 10-year Treasury rise by 1.2% over four months, as rate hikes are now expected.
- The lack of a buffer in today’s bond market suggests pressure may remain on bond prices as long as economic data continue to improve.
Click here to download a PDF of this report.
HOW FAST AND HOW HIGH
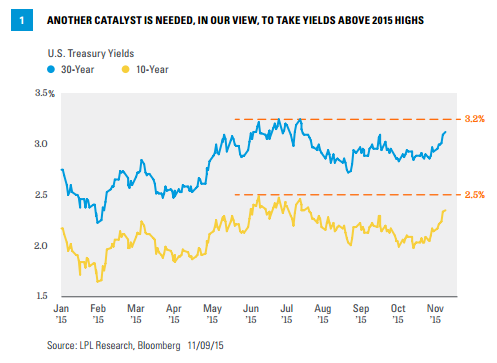
We do not believe last week’s sell-off is the start of a spike in interest rates. In fact, the spike may have already occurred with the 10-year Treasury yield higher by nearly 0.4% since October 14, 2015. The 30-year Treasury yield has also undergone a significant adjustment [Figure 1]. Yields on both 10- and 30-year benchmark Treasury yields have broken above the September highs and are within striking distance of 2015 highs of 2.5% and 3.2%, respectively. From a technical perspective, a breach above these levels would be needed to sustain a breakout to new yield highs.
We do not believe a repeat of the 2013 bond sell-off, known as the taper tantrum, is in store for investors. In 2013, the 10-year Treasury yield rose over a full percentage point in just four months with the Barclays Aggregate losing 4.9% over the period–one of the worst bond sell-offs on record.* The main difference is that a rate hike is now expected, unlike 2013 when the Federal Reserve (Fed) caught investors off-guard with the mere suggestion of “tapering” bond purchases.
*The Barclays Aggregate Bond Index declined, peak to trough, 4.9% from May 1, 2013 to September 5, 2013.
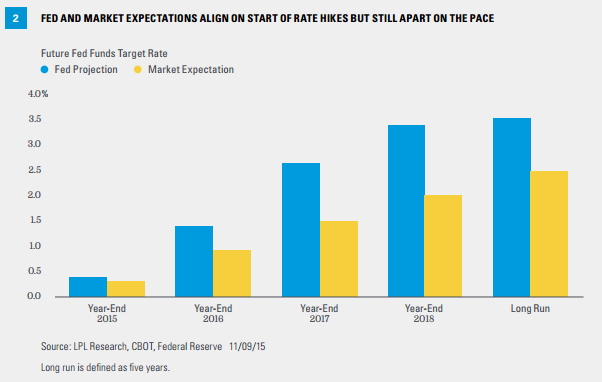
Bond markets reacted quickly to the employment report, and other economic data that surpassed forecasts, and Fed interest rate hike risk increased sharply. Futures now show that Fed and market expectations–as defined by the fed funds futures–for a December 2015 rate hike are aligned, but remain apart on the pace of future rate hikes [Figure 2].
HOW FAST AND HOW HIGH
How fast and how high yields rise is more dependent on the two factors below, rather than the simple start of Fed rate hikes:
- The pace. How quickly the Fed raises interest rates will be a primary factor in how much yields rise. Whether the Fed hikes rates every meeting, every other meeting (which is currently implied by futures), or every third meeting will determine how fast and how high bond yields may rise.
- How high. The final resting spot for the fed funds rate, whether it’s 2.0% or 4.0%, has a significant bearing on how high yields may go. As Figure 2 illustrates, market expectations (measured by futures) show the Fed raising the overnight lending rate to roughly 2.5%, a full percentage point below the Fed’s forecast of 3.5%.
Who’s right? We believe the truth likely lies somewhere in between the relatively downbeat market expectations and Fed forecasts. Current pricing, or forward interest rates, show a 10-year Treasury yield of 2.9% in three years if current market expectations come to fruition.
NOWHERE TO HIDE
Bond investors had nowhere to hide after last week’s stronger than expected employment report, which added to recent Treasury weakness but spread to other corners of the bond market. High-yield bonds, typically among the least sensitive to rising rates, suffered price declines on Friday, November 6, 2015, which erased gains from earlier in the week. Municipal bonds, resilient to Treasury weakness in October 2015, also saw price declines, although less than comparable Treasuries according to Barclays Index data. International bond markets also witnessed losses, taking their cues from U.S. markets despite central banks that are not on the precipice of raising interest rates. In short, it was a tough week for bond investors; the Barclays Aggregate Bond Index, a broad measure of high-quality bond performance, is now up 0.3% year to date through November 6, 2015.
STILL LIMITED BUFFER
Despite recent high-quality bond weakness, the bond market still does not fully reflect the prospects of ongoing rate hikes. The yield differential between the 2-year Treasury note, among the most sensitive to rate hike expectations, and the current fed funds target rate illustrates how far the bond market has gone to brace against Fed rate hikes. The greater the yield differential, the more bond prices have anticipated possible rate hikes and vice versa. The current yield spread between the 2-year Treasury and fed funds target rate is narrower than the last three times the Fed has initiated a rate hike campaign [Figure 3] and suggests bond weakness may linger over the near term until bond prices and yields better reflect the prospects of a Fed rate increase.
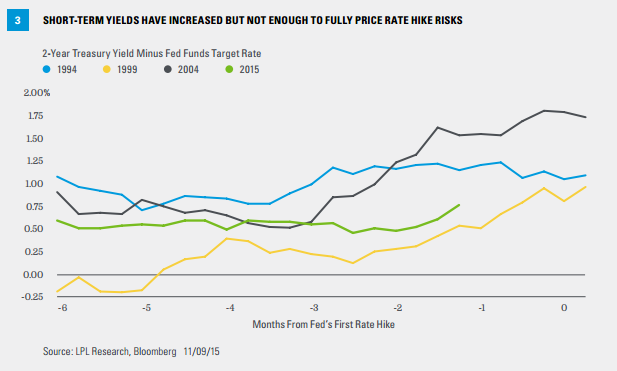
If the Fed does not follow through with a rate increase in December 2015, then current prices and yields may already reflect fair value. In any case, the current situation is unlike the start of rate hikes in 2004 when a hefty premium of 1.75% was already priced into short-term bonds and one reason why bond reaction to the 2004-06 rate hike campaign was relatively muted. The lack of a buffer in today’s bond market suggests pressure may remain on bond prices as long as economic data continue to improve.
IMPORTANT DISCLOSURES
The opinions voiced in this material are for general information only and are not intended to provide specific advice or recommendations for any individual. To determine which investment(s) may be appropriate for you, consult your financial advisor prior to investing. All performance reference is historical and is no guarantee of future results. All indexes are unmanaged and cannot be invested into directly.
The economic forecasts set forth in the presentation may not develop as predicted and there can be no guarantee that strategies promoted will be successful.
Bonds are subject to market and interest rate risk if sold prior to maturity. Bond values and yields will decline as interest rates rise, and bonds are subject to availability and change in price.
Government bonds and Treasury bills are guaranteed by the U.S. government as to the timely payment of principal and interest and, if held to maturity, offer a fixed rate of return and fixed principal value. However, the value of fund shares is not guaranteed and will fluctuate.
Investing in foreign and emerging markets debt securities involves special additional risks. These risks include, but are not limited to, currency risk, geopolitical and regulatory risk, and risk associated with varying settlement standards.
Municipal bonds are subject to availability, price, and to market and interest rate risk if sold prior to maturity. Bond values will decline as interest rates rise. Interest income may be subject to the alternative minimum tax. Federally tax-free but other state and local taxes may apply.
High-yield/junk bonds are not investment-grade securities, involve substantial risks, and generally should be part of the diversified portfolio of sophisticated investors.
INDEX DESCRIPTIONS
The Barclays U.S. Aggregate Bond Index is a broad-based flagship benchmark that measures the investment-grade, U.S. dollar-denominated, fixed-rate taxable bond market. The index includes Treasuries, government-related and corporate securities, MBS (agency fixed-rate and hybrid ARM pass-throughs), ABS, and CMBS (agency and non-agency).
The Barclays U.S. Municipal Index covers the USD-denominated long-term tax-exempt bond market. The index has four main sectors: state and local general obligation bonds, revenue bonds, insured bonds, and pre-refunded bonds.
The Barclays U.S. Treasury Index is an unmanaged index of public debt obligations of the U.S. Treasury with a remaining maturity of one year or more. The index does not include T-bills (due to the maturity constraint), zero coupon bonds (strips), or Treasury Inflation-Protected Securities (TIPS).
This research material has been prepared by LPL Financial LLC.
To the extent you are receiving investment advice from a separately registered independent investment advisor, please note that LPL Financial LLC is not an affiliate of and makes no representation with respect to such entity.
Not FDIC or NCUA/NCUSIF Insured | No Bank or Credit Union Guarantee | May Lose Value | Not Guaranteed by Any Government Agency | Not a Bank/Credit Union Deposit
Tracking #1-438900 (Exp. 11/16)