
KEY TAKEAWAYS
- More expensive valuations and lower yields may slow the pace of municipal bond performance.
- Within municipal bonds, we prefer the reduced interest rate sensitivity of intermediate- and long-term municipal bonds.
Click here to download a PDF of this report.
MUNICIPAL SLOWDOWN
After a positive four-month run, municipal bonds may have to brace for a slowdown. Since the start of the third quarter through the end of October 2015, municipal bonds stood out in a challenging environment for bonds. The Barclays 7-Year Municipal Bond Index, a proxy for intermediate municipal bond performance, returned 2.2% over the four-month time frame compared with 1.4% for Treasuries (Barclays Treasury Index), whose interest rate sensitivity is roughly the same.
The summer tailwind that benefited all high-quality bonds turned to autumn headwinds for most, with the exception of municipal bonds. Treasury prices weakened over October, while municipal bond prices remained relatively stable and resilient to a modest increase in government bond yields during the month.
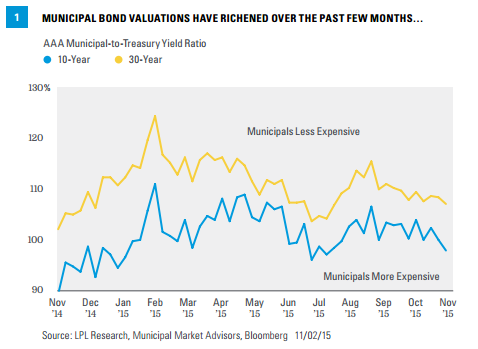
HIGHER VALUATIONS
We have argued that municipal bonds may provide a buffer to price declines associated with rising interest rates, even October’s modest increase, but municipal bond sensitivity to Treasuries may increase over the rest of 2015. Longer term, municipal bond valuations remain attractive, but recent strength has led to richer municipal bond valuations relative to Treasuries [Figure 1]. Average 10- and 30-year AAA municipal-to-Treasury yield ratios decreased over the past few months and the 10-year ratio is now back below 100% for the first time in four months. Over the short term, higher valuations may signal caution.
LOWER YIELDS
Municipal-to-Treasury yield ratios must be placed in the context of yields, however. Yes, valuations, as defined by yield ratios, are at their most expensive since early July–when municipal outperformance began–but yields are lower now [Figure 2] compared with early July. Average AAA 10- and 30-year municipal bond yields are 0.25% and 0.30% lower, respectively, compared with the start of July 2015. Such declines appear small to many investors but are noteworthy in a low-yield world.
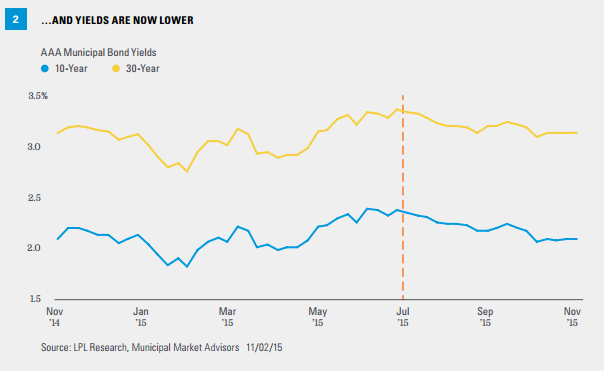
Additionally, the 2% and 3% yield level, respectively, for both 10- and 30-year municipal bond yields, may provide resistance to further gains. These yield barriers have been breached over the past year but not for long. The proximity of the 2% and 3% yield barriers may restrain demand. The combination of lower yields and more expensive valuations could give investors pause and slow the pace of municipal bond performance.
LIMITED SUPPLY
However, a key driver of recent municipal bond strength appears set to continue: limited supply. A seasonal increase in new issuance started later in 2015, compared with prior years’ average, and already appears to have tapered off [Figure 3]. The end of summer typically ushers in a period of increased new issuance as states and municipalities return to market. The increase represents a multi-week rush before year-end and less liquid markets that accompany the holidays.
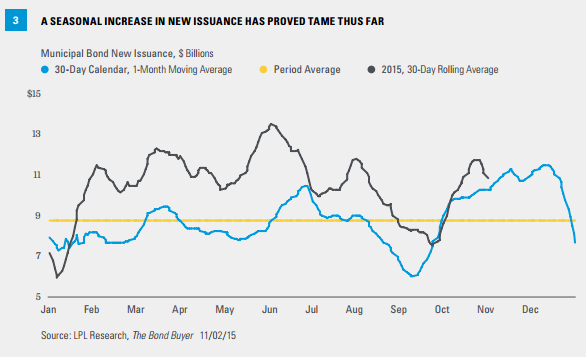
A surge in new issuance over the first half of 2015 may have pre-empted late year issuance. The 30-day moving average of new supply remains elevated at just under $11 billion, but has clearly slowed. As of November 2, 2015, the current reading on the Bond Buyer’s 30-day visible supply dipped to $10 billion, not far above the monthly average and level, which should keep supply tight for investors.
For all of 2015, the outstanding municipal bond market is likely to see very limited net growth. This may present a small offset to shrinking market dynamics in place since the end of 2010, but not a meaningful one for tax-exempt bond investors. Limited supply may still provide underlying support to municipal bonds.
HIGH-YIELD MUNICIPALS
The high-yield municipal bond market has also benefited from municipal bond strength but not from valuation improvement, as yield spreads have been relatively stable in recent weeks. The greater interest rate sensitivity of the tax-free high-yield market gives us caution ahead of a potential Federal Reserve interest rate. We prefer the reduced interest rate sensitivity of intermediate- and long-term municipal bonds.
Municipal bonds outperformed their taxable counterparts over the past few months and remain ahead on a year-to-date basis (2.53% versus 1.42% as of October 30, 2015). Long-term valuations still appear attractive; but over the short term, the combination of lower yields and more expensive valuations signals a slowdown in performance. Municipal bonds may increasingly take their cues from Treasuries.
IMPORTANT DISCLOSURES
The opinions voiced in this material are for general information only and are not intended to provide specific advice or recommendations for any individual. To determine which investment(s) may be appropriate for you, consult your financial advisor prior to investing. All performance reference is historical and is no guarantee of future results. All indexes are unmanaged and cannot be invested into directly.
The economic forecasts set forth in the presentation may not develop as predicted and there can be no guarantee that strategies promoted will be successful.
Bonds are subject to market and interest rate risk if sold prior to maturity. Bond values and yields will decline as interest rates rise, and bonds are subject to availability and change in price.
Government bonds and Treasury bills are guaranteed by the U.S. government as to the timely payment of principal and interest and, if held to maturity, offer a fixed rate of return and fixed principal value. However, the value of fund shares is not guaranteed and will fluctuate.
Municipal bonds are subject to availability, price, and to market and interest rate risk if sold prior to maturity. Bond values will decline as interest rates rise. Interest income may be subject to the alternative minimum tax. Federally tax-free but other state and local taxes may apply.
High-yield/junk bonds are not investment-grade securities, involve substantial risks, and generally should be part of the diversified portfolio of sophisticated investors.
INDEX DESCRIPTIONS
The Barclays U.S. Municipal Index covers the USD-denominated long-term tax-exempt bond market. The index has four main sectors: state and local general obligation bonds, revenue bonds, insured bonds, and pre-refunded bonds.
The Barclays Municipal High Yield Bond Index is comprised of bonds with maturities greater than one-year, having a par value of at least $3 million issued as part of a transaction size greater than $20 million, and rated no higher than ‘BB+’ or equivalent by any of the three principal rating agencies.
The Barclays U.S. Treasury Index is an unmanaged index of public debt obligations of the U.S. Treasury with a remaining maturity of one year or more. The index does not include T-bills (due to the maturity constraint), zero coupon bonds (strips), or Treasury Inflation-Protected Securities (TIPS).
The Barclays 7-year Municipal Bond Index is the 7 Year (6-8 year) component of the Barclays Municipal Bond, which is a rules-based, market-value-weighted index engineered for the long-term tax-exempt bond market.
DEFINITIONS
Credit quality is one of the principal criteria for judging the investment quality of a bond. As the term implies, credit quality informs investors of a bond or bond portfolio’s credit worthiness, or risk of default. Different agencies employ different rating scales for credit quality. Standard & Poor’s (S&P) and Fitch both use scales from AAA (highest) through AA, A, BBB, BB, B, CCC, CC, C to D (lowest). Moody’s uses a scale from Aaa (highest) through Aa, A, Baa, Ba, B, Caa, Ca to C (lowest). Default rate is the rate in which debt-holders default on the amount of money that they owe. It is often used by credit card companies when setting interest rates, but also refers to the rate at which corporations default on their loans.
Municipal Market Advisors is an independent strategy, research and advisory firm.
The 30-day visible supply is compiled daily from The Bond Buyer’s Competitive and Negotiated Bond Offerings calendars. It reflects the dollar volume of bonds expected to reach the market in the next 30 days. Issues maturing in 13 months or more are included.
This research material has been prepared by LPL Financial LLC.
To the extent you are receiving investment advice from a separately registered independent investment advisor, please note that LPL Financial LLC is not an affiliate of and makes no representation with respect to such entity.
Not FDIC or NCUA/NCUSIF Insured | No Bank or Credit Union Guarantee | May Lose Value | Not Guaranteed by Any Government Agency | Not a Bank/Credit Union Deposit
Tracking #1-436572 Exp. 11/16)