
KEY TAKEAWAYS
- The service sector, which accounts for 70% of U.S. GDP, remains robust per the latest ISM Non-Manufacturing Report.
- However, the manufacturing economy is teetering on the edge of contraction.
- A dip in the manufacturing ISM to below 50 would not be (and has not been) a signal that the broader economy is headed for recession.
Click here to download a PDF of this report.
ISM INDICATES FAIRLY ROBUST ECONOMIC ACTIVITY CONTINUES
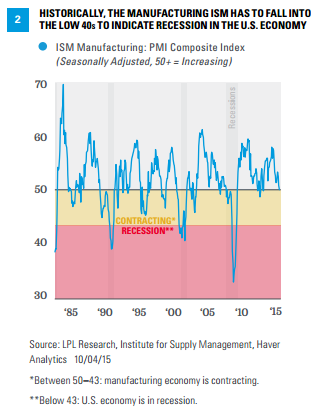
The Institute for Supply Management (ISM) released its Non-Manufacturing Report on Business for September 2015 on Monday, October 5, 2015, as this Weekly Economic Commentary was being prepared for publication. It showed that the service sector remains robust, with the non-manufacturing ISM hitting 56.9, which over time, is consistent with real gross domestic product (GDP) of 3.5%. However, the report, as usual, was largely ignored by market participants, even though non-manufacturing activity (mainly the service sector) represents 70% of the U.S. economy. Financial markets, however, correctly focus more closely on ISM’s Manufacturing Report on Business, as S&P earnings–which over time, drive stock prices–are much more closely correlated to the manufacturing portion of the economy than to the service side.
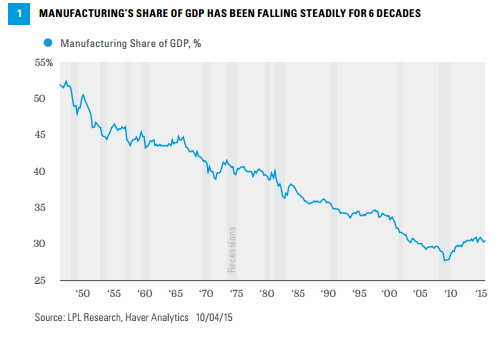
But for those concerned about a U.S. recession, the recent data on both the non-manufacturing and manufacturing ISMs are comforting. As noted above, the non-manufacturing ISM readings of 56.7 in September and 57.3 so far in 2015 indicate fairly robust economic activity continues in 70% of the U.S. economy. The manufacturing ISM data, however, are more concerning. Released last week, the manufacturing ISM for September 2015 came in at 50.2, below the consensus of economists as polled by Bloomberg News (50.6) and the August 2015 reading of 51.1. In fact, the September 2015 reading on the ISM was the lowest since May 2013, and indicates that the manufacturing economy, which accounts for just 30% of the U.S. economy [Figure 1], is teetering on the edge of contraction. But what about the broader economy? The ISM noted in the press release accompanying the data that “a reading above 50 percent indicates that the manufacturing economy is generally expanding; below 50 percent indicates that it is generally contracting.”
The manufacturing ISM has averaged 52.2 over the first nine months of 2015, which, if sustained, would be the lowest average reading on the ISM since 2012, when it averaged 51.7. But the Institute for Supply Management press release notes that an average reading of 52.2 on the manufacturing ISM is consistent with growth in real GDP of 2.9%, which is just shade below our long-held forecast of 3.0%+ for 2015.
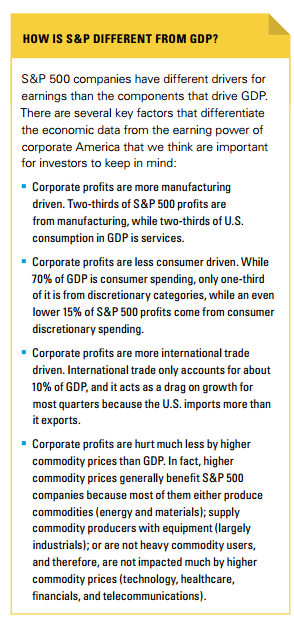
The last time the manufacturing ISM averaged below 50 was in the recession years of 2008 (45.5) and 2009 (46.4). As a reminder, the ISM would have to dip to the low 40s to indicate that the overall economy was in recession [Figure 2].
As the manufacturing ISM nears 50 in the current business cycle–close to indicating a contraction in the manufacturing sector but still a long way from signaling an economy-wide recession–we note that the manufacturing ISM has dipped to 50 (or below) in each of the last three expansions without a recession actually occurring. Similar to today, a substantial drop in oil prices played a part in all three of these episodes.
LESESONS FROM PAST ECONOMIC EXPANSIONS
A hallmark of the 2001-2007 economic expansion was the relentless rise in oil prices, driven by voracious demand from emerging market economies, led by China. Still, pauses in that run-up in oil that ultimately contributed to the Great Recession did correspond to dips in the manufacturing ISM. Just 18 months into the expansion, in July 2002, the manufacturing ISM slipped to 50.2 and remained below 50 through mid-2003. During that time–although short lived–oil prices fell about 15%. The manufacturing ISM dipped from a high of 61.4 in May 2004 to as low as 50.8 by May 2005, but that dip was not associated with a drop in oil prices. The manufacturing ISM moved below 50 again in January 2007, from as high as 57.2 in October 2005. Here again, oil may have been a culprit–along with tightening financial conditions–as oil prices fell more than 20% over that time, before nearly tripling between early 2007 and mid-2008.
In the economic expansion that began in 1991, the manufacturing ISM fell below 50 on several occasions and a recession did not ensue. Each time, the dip below 50 was accompanied by a substantial decline in oil prices, but overall economic growth remained solid. Early in the recovery (mid-1991 through mid-1993), the manufacturing ISM was at or below 50 three times before accelerating through 1993 and 1994. Oil fell 25% between mid-1991 and mid-1993 while real GDP averaged 3.0%. In the middle of the expansion that began in 1991, the manufacturing ISM fell below 50 in May 1995 and remained there for a full year, as oil prices fell 15%. Real GDP growth averaged 3.1% during this period. Late in the 1990s expansion, as oil prices fell 50% in reaction to the Asian financial crisis in 1997-1999, the manufacturing ISM again dipped below 50 (June 1998) and stayed there until December 1998. Real GDP growth averaged 6% in the second half of 1998.
In the economic expansion that began in late 1982, the manufacturing ISM crossed below 50 in September 1984. For the next 27 months, through December 1986, the manufacturing ISM was above 52.0 in just two months and was below 50 nearly half the time. During that year, real GDP growth averaged 3.5% even as oil prices fell 60%, from $29 per barrel to as low as $12.
OIL’S IMPACT
History doesn’t always repeat itself, and each business cycle is different. For example, in the expansions of the early 2000s, 1990s, and 1980s, the U.S. oil and gas industry was in the midst of a long-term decline. In the current economic expansion that began in mid-2009, the oil and gas industry has been on the rebound, reversing a multi-decade decline in oil and gas output in the United States. Thus, while still a net plus for the U.S. economy (see the Weekly Economic Commentary, “Before and After”), the recent drop in oil prices has had a significant impact on the U.S. manufacturing economy, and that impact can be seen in not only the weakness in the manufacturing ISM, manufacturing industrial production, and employment in the manufacturing sector, but also in the 60% drop in earnings for companies in the S&P 500 energy sector. Because the U.S. economy is still a net beneficiary of low energy prices and the service sector accounts for nearly 70% of GDP, a dip in the manufacturing ISM to below 50 would not be (and has not been) a signal that the broader economy is headed for recession.
IMPORTANT DISCLOSURES
The opinions voiced in this material are for general information only and are not intended to provide specific advice or recommendations for any individual. To determine which investment(s) may be appropriate for you, consult your financial advisor prior to investing. All performance reference is historical and is no guarantee of future results. All indexes are unmanaged and cannot be invested into directly.
The economic forecasts set forth in the presentation may not develop as predicted.
Investing in stock includes numerous specific risks including: the fluctuation of dividend, loss of principal and potential illiquidity of the investment in a falling market.
Because of its narrow focus, specialty sector investing, such as healthcare, financials, or energy, will be subject to greater volatility than investing more broadly across many sectors and companies.
DEFINITIONS
The Institute for Supply Management (ISM) index is based on surveys of more than 300 manufacturing firms by the Institute of Supply Management. The ISM Manufacturing Index monitors employment, production inventories, new orders, and supplier deliveries. A composite diffusion index is created that monitors conditions in national manufacturing based on the data from these surveys.
Purchasing Managers’ Indexes (PMI) are economic indicators derived from monthly surveys of private sector companies, and are intended to show the economic health of the manufacturing sector. A PMI of more than 50 indicates expansion in the manufacturing sector, a reading below 50 indicates contraction, and a reading of 50 indicates no change. The two principal producers of PMIs are Markit Group, which conducts PMIs for over 30 countries worldwide, and the Institute for Supply Management (ISM), which conducts PMIs for the U.S.
The S&P 500 Index is a capitalization-weighted index of 500 stocks designed to measure performance of the broad domestic economy through changes in the aggregate market value of 500 stocks representing all major industries.
This research material has been prepared by LPL Financial.
To the extent you are receiving investment advice from a separately registered independent investment advisor, please note that LPL Financial is not an affiliate of and makes no representation with respect to such entity.
Not FDIC or NCUA/NCUSIF Insured | No Bank or Credit Union Guarantee | May Lose Value | Not Guaranteed by Any Government Agency | Not a Bank/Credit Union Deposit
Tracking #1-426957 (Exp. 10/16)