
KEY TAKEAWAYS
- High-yield bond valuations have cheapened in sympathy with equity market volatility but have shown relative resilience.
- Some signs of credit quality deterioration have emerged but remain at the fringes of the market and are not representative of corporate bonds overall.
- Corporate bond prices may have moved more than justified by fundamental data.
Click here to download a PDF of this report.
As the U.S. economy enters the second half of this business cycle, a sporadic credit checkup can be just what the doctor ordered. A close look at the high-yield market shows some slight signs of credit quality deterioration emerging, but for now the market, despite recent challenges, shows relatively stable vital signs.
High-yield has taken a prominent role in investors’ minds as of late. The weakness in the price of oil led to dramatic spread widening in high-yield energy (+1.75% since the beginning of August), which led to spread widening across the broader high-yield market (+.80% since the beginning of August). The weakness in high-yield, as noted in previous Bond Market Perspectives, has been primarily driven by fear of energy-related defaults. As noted last week, the implied default rate on the high-yield energy sector is greater than 15% over a one-year time frame. The actual rate, based on the first six months of 2015, is just 3%. We view such a big acceleration in defaults as unrealistic.
In a market currently driven by fear, it can be prudent to take a step back and evaluate the overall financial health of the high-yield bond market within the context of the credit cycle. In doing so, we may be able to determine whether this fear is justified or perhaps an attractive entry point for value-conscious investors.
FUNDAMENTALS STILL STRONG
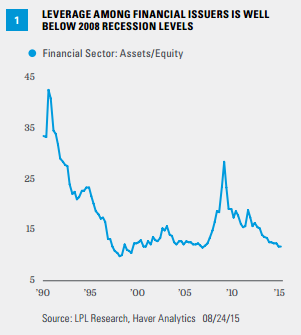
Leverage is a focal measure of the health of the corporate bond markets. Thanks in part to new regulations, the creditworthiness of financial institutions remains very strong even if growth prospects are modest. A look at leverage in the financial sector shows that financial firms are still relatively unlevered compared to the peaks of 2008 and 2009 [Figure 1].
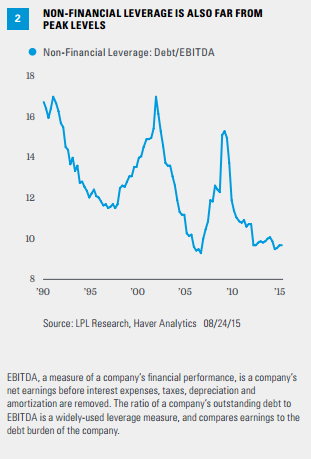
Similarly, leverage employed by non-financial corporate borrowers increased in recent quarters but is still significantly below levels seen in 2008 and 2009 [Figure 2].
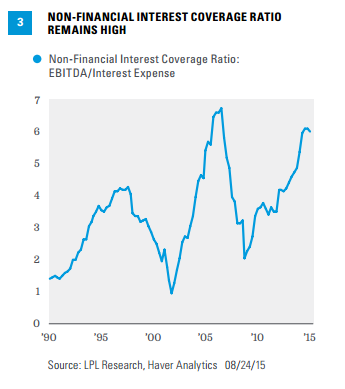
Leverage alone does not tell the whole story, however. The cost to service that debt is important, and the interest coverage ratio, a measure of how easily companies can cover interest payments, still remains near a post-recession high as issuers have taken advantage of low interest rates. On average, non-financial firms can cover their interest payments nearly six times over, the highest level since 2006 [Figure 3].
LEADING INDICATOR OF DEFAULTS STILL BENIGN
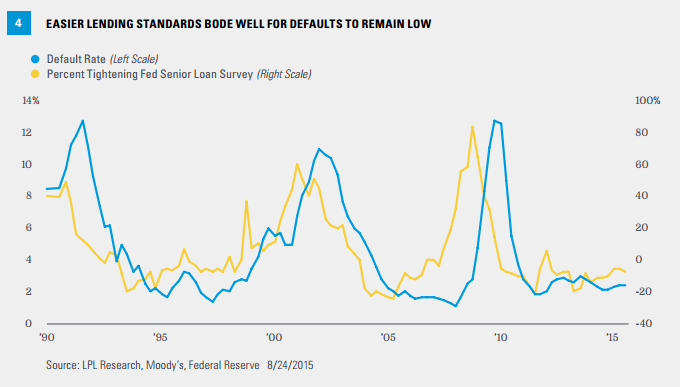
The Federal Reserve’s (Fed) Senior Loan Officer Survey is a good leading indicator of defaults for high-yield bond issuers. Banks have continued to ease lending standards, which should aid liquidity and help keep defaults low [Figure 4].
HIGH-YIELD ISSUANCE TRENDS
The purpose of new debt issuance can reveal a lot about credit quality trends in the high-yield bond market. Refinancing-related issuance is most favorable from a bondholder perspective, as this is generally considered preferable to more speculative uses like leveraged buyouts, acquisitions, or other shareholder-friendly activities such as special dividends. Refinancing does not result in an increase in leverage, whereas the other uses generally do. In 2015, the proportion of debt used for acquisitions increased modestly from 2014 levels but leveraged buyout issuance, which surged in 2006 and 2007, has failed to come back to life in the high-yield bond market. Growth in capital expenditures remains subdued at 4%, indicating that high-yield issuers, on balance, are relatively cautious about taking on new projects.
RESILIENCE
Despite recent equity market volatility, the reaction from the bond market has been somewhat restrained. High-yield bonds held up better than equities over the past week. From Monday, August 17, 2015, through Monday, August 24, 2015, the Barclays High-Yield Bond Index declined 1.6% compared to the 9.4% decline of stocks, as measured by the S&P 500 Index. The current bout of volatility has led to corporate bonds, both investment-grade and high-yield, underperforming Treasuries. However, considering the damage to stocks last week, high-yield bonds have shown greater resilience compared to equities. Historically, high-yield bonds have exhibited roughly 25-50% of the volatility of stocks. High-yield underperformance relative to Treasuries since late June helps explain this, as the bond market may have better priced in risks earlier this summer.
Current market volatility is exerting downward pressure on corporate bond prices, but weaker fundamentals, or an uptick in defaults, are necessary to justify the now more attractive valuations, in our view. Despite some concerns with excesses at the margins, the overall credit market appears to be on stable footing and, on balance, deserves a relatively clean bill of health.
IMPORTANT DISCLOSURE
The economic forecasts set forth in the presentation may not develop as predicted and there can be no guarantee that strategies promoted will be successful.
EBITDA, a measure of a company’s financial performance, is a company’s net earnings before interest expenses, taxes, depreciation and amortization are removed. The ratio of a company’s outstanding debt to EBITDA is a widely-used leverage measure, and compares earnings to the debt burden of the company.
Bonds are subject to market and interest rate risk if sold prior to maturity. Bond values and yields will decline as interest rates rise, and bonds are subject to availability and change in price.
Government bonds and Treasury bills are guaranteed by the U.S. government as to the timely payment of principal and interest and, if held to maturity, offer a fixed rate of return and fixed principal value. However, the value of fund shares is not guaranteed and will fluctuate.
High-yield/junk bonds are not investment-grade securities, involve substantial risks, and generally should be part of the diversified portfolio of sophisticated investors.
Corporate bonds are considered higher risk than government bonds but normally offer a higher yield and are subject to market, interest rate, and credit risk as well as additional risks based on the quality of issuer coupon rate, price, yield, maturity, and redemption features.
Commodity-linked investments may be more volatile and less liquid than the underlying instruments or measures, and their value may be affected by the performance of the overall commodities baskets as well as weather, geopolitical events, and regulatory developments.
INDEX DEFINITIONS
The Barclays High Yield Index covers the universe of publicly issued debt obligations rated below investment grade. Bonds must be rated below investment grade or high yield (Ba1/BB+ or lower), by at least two of the following ratings agencies: Moody’s, S&P, and Fitch. Bonds must also have at least one year to maturity, have at least $150 million in par value outstanding, and must be U.S. dollar denominated and nonconvertible. Bonds issued by countries designated as emerging markets are excluded.
The S&P 500 Index is a capitalization-weighted index of 500 stocks designed to measure performance of the broad domestic economy through changes in the aggregate market value of 500 stocks representing all major industries.
DEFINITIONS
Credit Quality is one of the principal criteria for judging the investment quality of a bond or bond mutual fund. As the term implies, credit quality informs investors of a bond or bond portfolio’s credit worthiness, or risk of default.
Yield Spread is the difference between yields on differing debt instruments, calculated by deducting the yield of one instrument from another. The higher the yield spread, the greater the difference between the yields offered by each instrument. The spread can be measured between debt instruments of differing maturities, credit ratings and risk.
This research material has been prepared by LPL Financial.
To the extent you are receiving investment advice from a separately registered independent investment advisor, please note that LPL Financial is not an affiliate of and makes no representation with respect to such entity.
Not FDIC or NCUA/NCUSIF Insured | No Bank or Credit Union Guarantee | May Lose Value | Not Guaranteed by Any Government Agency | Not a Bank/Credit Union Deposit
Tracking #1-414143