
KEY TAKEAWAYS
- We expect another quarterly earnings gain in the second quarter despite the drags from oil and the U.S. dollar.
- Improved global growth, lower energy costs, and effective cost controls have supported overall results.
- Although forward estimates have edged lower, we continue to expect earnings growth to accelerate during the second half of the year.
Click here to download a PDF of this report.
EARNINGS UPDATE: CORPORATE RESILIENCE
Once again, earnings season highlights corporate America’s resilience. Investors were braced for an earnings decline in the second quarter of 2015 but will almost certainly end up with another quarterly earnings gain despite the significant drags from the oil downturn and strong U.S. dollar, largely thanks to effective cost controls that have propped up profit margins. With more than two-thirds of S&P 500 companies having reported second quarter 2015 results, we provide an earnings update.
SOLID PERFORMANCE (EX-ENERGY)
With 70% of S&P 500 companies having reported as of July 31, 2015, the S&P 500 is on track to produce another year-over-year earnings gain. The average upside surprise of 5% thus far positions the S&P 500 to deliver a 2% increase when all results are in (same as the first quarter result), a good number compared with recent trends. The earnings “beat rate” of 72% is five points above the first quarter of 2015 and six points above the three-year average. Revenue results have been more mixed, with the revenue beat rate at 50%, six points above last quarter but five points below the three-year average.
Second quarter’s earnings performance is particularly impressive when removing the energy sector’s expected nearly 60% year-over-year decline. Excluding energy, S&P 500 earnings growth is tracking to 8-9% [Figure 1], an excellent growth rate, especially considering that the strong U.S. dollar is also dragging down S&P 500 earnings, though not by quite as much (estimated 3-4%). Company results (outside of the energy sector) have been supported by improved global growth, lower energy costs, and effective cost controls.
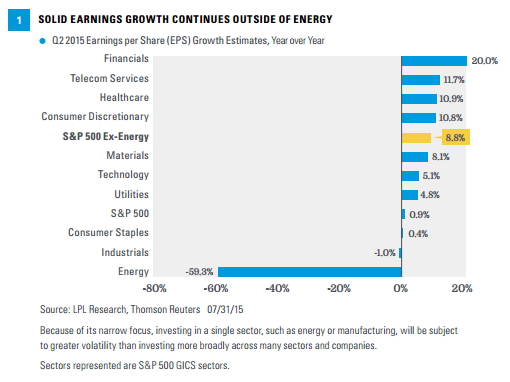
The upside to earnings estimates is coming primarily from these sectors:
- Healthcare. The healthcare sector has produced the biggest upside to prior estimates among all sectors thus far (tracking to 10.9% versus prior estimate of 4.1%) driven by pharmaceuticals, biotech, and medical technology. The sector, which remains one of our favorites, continues to benefit from strong drug development trends and the increasing number of insured patients under the Affordable Care Act.
- Financials. Solid loan growth (particularly business loans), a steeper yield curve (which helps net interest margins, a key source of bank profits), low default rates, healthy merger and equity trading activity, and more progress resolving legacy regulatory costs all helped drive solid earnings growth (20%) and upside to expectations for financials.
- Consumer discretionary. Lower prices at the pump relative to a year ago, a housing market that gained steam during the second quarter, and rapid growth in the internet retail sector helped drive solid upside in consumer discretionary earnings during the second quarter.
- Energy. Sharply lower oil prices have driven energy sector earnings down significantly. However, oil prices rose from the first quarter of 2015 to the second quarter, helping the sector thus far produce solid revenue upside, which has led to better than expected earnings. The refining business continues to be a relative bright spot.
LIMITED OVERSEAS DISRUPTION
As we wrote in our earnings season preview on July 13, 2015, we did not expect Greece-related weakness in Europe or severe stock market volatility in China to have a meaningful impact on earnings. That has largely been the case, although several industrial companies with larger exposure to China have cited some demand weakness there, contributing to the lack of earnings upside produced by industrials. Industrials have also been hurt by commodity sensitivity and global reach, leading to a disproportionate impact from the strong dollar.
A few companies have cited weakness in Europe but they have been few and far between. One retailer cited currency volatility as an issue, while a cruise line mentioned macroeconomic challenges in Europe. Most large cap companies have cited healthy activity in Europe that was generally in-line with or better than previous expectations. The limited reduction in forward 12-month estimates for the S&P 500 (-0.6% versus the long-term average of -2%) since earnings season began and the favorable trend in global economic data provide evidence that the environment overseas has not deteriorated meaningfully since the end of the first quarter.
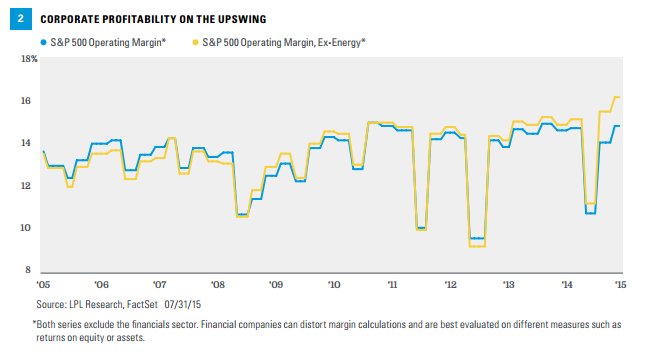
MARGINS ARE THE STORY
With earnings on pace for a modest gain and revenue tracking toward an approximate 3% year-over-year decline, the story this quarter is again strong profit margins. As shown in Figure 2, excluding the energy sector, corporate profit margins are at more than 10-year highs and have ticked higher in recent quarters despite repeated calls from many market pundits for margin contraction. There are many drivers of improved profitability (excluding the energy sector), including low commodity prices, low borrowing costs, low wage inflation, and corporate efficiency partly through broader deployment of technology. Share buybacks continue to provide a boost as well.
RESILIENT GUIDANCE
We thought that earnings estimates had a reasonable chance to increase during this earnings season based on prior estimate reductions and the improving global macroeconomic environment. With 70% of companies having reported, we are very close, with only a 0.6% reduction to the forward 12-month estimates. This reduction in estimates is smaller than those observed in recent quarters (2-3%) and reflects corporate resilience in the face of significant headwinds. We continue to expect earnings to accelerate during the second half of the year, driven by potentially better U.S. and overseas economic growth, solid profit margins, benefits from lower energy costs, and smaller drags from the U.S. dollar and energy.
CONCLUSION
Corporate America has again shown its resilience during the second quarter earnings season. Investors were braced for an earnings decline but will almost certainly end up with another gain, despite significant drags from the energy downturn and strong dollar. Looking ahead, although forward estimates have edged lower, we continue to expect earnings to accelerate during the second half of the year.
Earnings figures may vary depending on the source (Thomson, FactSet, Bloomberg, etc.). Data providers have different methodologies for calculating S&P 500 earnings, and different interpretations of what constitutes operating earnings as compared with reported (GAAP) earnings.
IMPORTANT DISCLOSURES
The opinions voiced in this material are for general information only and are not intended to provide specific advice or recommendations for any individual. To determine which investment(s) may be appropriate for you, consult your financial advisor prior to investing. All performance referenced is historical and is no guarantee of future results.
The economic forecasts set forth in the presentation may not develop as predicted and there can be no guarantee that strategies promoted will be successful.
Investing in stock includes numerous specific risks including: the fluctuation of dividend, loss of principal, and potential liquidity of the investment in a falling market.
Investing in foreign and emerging markets securities involves special additional risks. These risks include, but are not limited to, currency risk, geopolitical risk, and risk associated with varying accounting standards. Investing in emerging markets may accentuate these risks.
INDEX DESCRIPTIONS
The Standard & Poor’s 500 Index is a capitalization-weighted index of 500 stocks designed to measure performance of the broad domestic economy through changes in the aggregate market value of 500 stocks representing all major industries.
DEFINITIONS
Global Industry Classification Standard (GICS) is a standardized classification system for equities developed jointly by Morgan Stanley Capital International (MSCI) and Standard & Poor’s. The GICS methodology is used by the MSCI indexes, which include domestic and international stocks, as well as by a large portion of the professional investment management community. The GICS hierarchy begins with 10 sectors and is followed by 24 industry groups, 67 industries and 147 sub-industries. Each stock that is classified will have a coding at all four of these levels. The 10 GIC Sectors are as follows: energy, materials, industrials, consumer discretionary, consumer staples, healthcare, financials, information technology, telecommunication services, and utilities.
This research material has been prepared by LPL Financial.
To the extent you are receiving investment advice from a separately registered independent investment advisor, please note that LPL Financial is not an affiliate of and makes no representation with respect to such entity.
Not FDIC or NCUA/NCUSIF Insured | No Bank or Credit Union Guarantee | May Lose Value | Not Guaranteed by Any Government Agency | Not a Bank/Credit Union Deposit
Tracking #1-406521 (Exp. 08/16)