KEY TAKEAWAYS
- The additional supply expected from Iran and the slow response by producers to reduce supply may lengthen oil’s stay in the $50-60 range.
- We have tempered our previous enthusiasm for the energy sector and at current oil price levels view it as a market performer.
Click here to download a PDF of this report.
OIL’S LONG BOTTOMING PROCESS
The nuclear agreement with Iran has put a lot of attention back on oil. The resulting lifting of sanctions is expected to lead to Iran releasing an additional 800-900 thousand barrels per day of oil back into global markets. What impact might this additional production have on oil prices? Here we provide our updated view on oil prices and the energy sector.
TIMING IS EVERYTHING
Iranian oil will take some time to reach the global market. Some oil that is currently stored on tankers and waiting for sanctions to be lifted may be sold into the global market in the next few months. But the majority of Iranian oil exports that will be freed up as a result of the nuclear agreement–potentially 1% of global production–will not reach the market until well into 2016.
Timing is the key as demand may increase sufficiently by the time the increase in supply arrives. According to the Energy Information Administration (EIA), global oil demand is expected to increase by 1.4 million barrels in 2016, driven by growth in the U.S., Europe, and Asia. The additional time for demand to rise will help the oil market manage the additional Iranian supply. The recent price drop is also likely due in part to Iran’s eventual supply increase and may already be priced in. Additionally, there is downside to Iran’s production estimates given the country’s inefficiency as a producer. Bottom line, Iran is a factor but not a game changer.
FOUR SIGNS OIL PRICES ARE POTENTIALLY NEAR A BOTTOM
Some of the reasons we turned more positive on the energy sector back in April remain in place today and suggest that oil prices may find a bottom at around $50 a barrel. They are:
- Producer capital spending cuts. Reductions in capital spending plans by oil producers will impact future production, but do not impact supply today. That said, the major U.S. oil producers have announced capital spending reductions between 10% and 25% in response to lower oil prices (many smaller producers have announced cuts of 30% or more). Spending plans do not help balance the oil market in the near term, but they should help put in a floor for prices in the intermediate to longer term as investors brace for lower future supply.
- Plummeting rig counts. Drilling rig counts have fallen by nearly 60% from their peak in September 2014, a similar magnitude decline to prior periods of significant oil price declines. Fewer rigs do provide oil price support by signaling supply reductions are coming. However, producers are doing more with fewer rigs and maintaining production at a lower cost (partly by leaving the most productive rigs active). This producer efficiency is good for the producers’ profit margins (and is a reason we still think energy sector profits may surprise to the upside in the second half), but it delays supply reductions, and therefore, keeps prices from rising.
- The magnitude of the oil price decline. Oil is down 53% from the June 2014 peak as of Friday, July 17, 2015, after a 59% peak-to-trough decline through March 17, 2015. The seven biggest oil price declines over the past 30 years averaged 54% peak to trough. Outside of the financial crisis in 2008-2009, the biggest oil price drops over the past 30 years occurred in 1986 (64%) and 1998 (59%). The absence of a severe recession, like that of 2008, suggests that an even greater decline is unlikely and oil is near a bottom at about $50.
- Marginal cost of U.S. shale production. The cost to extract U.S. oil varies by region and by producer, but a large majority of producers cite costs between $40 and $60 per barrel. As a result, prices in the $40s discourage production and put a floor under prices.
BUT HEADWINDS ARE STIFF
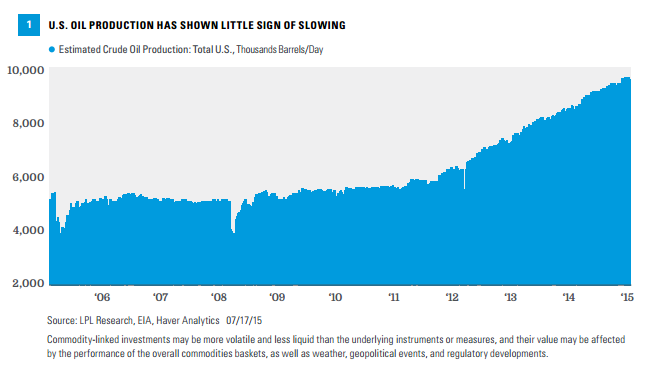
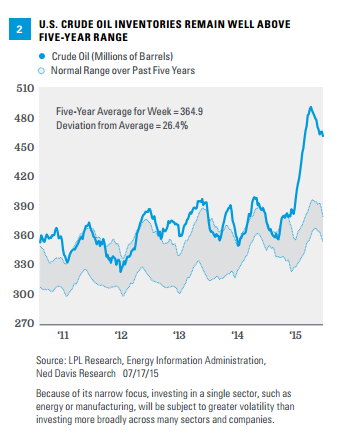
Two factors make us reluctant to be oil bulls despite the likelihood that oil prices are near a bottom: production and technical analysis. Production hasn’t slowed down much at all, despite sharply lower oil prices [Figure 1] and significant rig count reductions as producers have become more efficient. Contractual obligations to drill may also be propping up supply even at lower prices (“use it or lose it” clauses). Continued production has kept inventory levels high as a result [Figure 2] and delayed the supply-demand balancing process.


In fact, U.S. crude oil production has increased quite a bit since oil prices started to fall last June. Production averaged about 8.4 million barrels in June 2014 when crude oil was above $100; and now (as of June 2015), it is averaging more than 9.5 million per week, a 13% increase despite oil prices being cut in half. The EIA expects only a modest U.S. production drop in 2016 despite its forecast that oil prices will remain low. Specifically, in 2016 the EIA expects a decrease in U.S. crude oil production of 300 thousand barrels, down to 9.3 million barrels per day, even at an expected average price of just $62.
Despite the expected increase in future demand, it may be difficult to mop up all of the excess global supply quickly enough for prices to stage much of a rally this year. An oil price resurgence in 2015 will likely require upside to demand from stronger global economic growth in Europe, Japan, China, and the U.S.
Supply will eventually adjust to meet demand–but that adjustment may simply not happen fast enough to make energy an attractive investment in the near term. Based on supply and demand, fair value may be in the $50s.
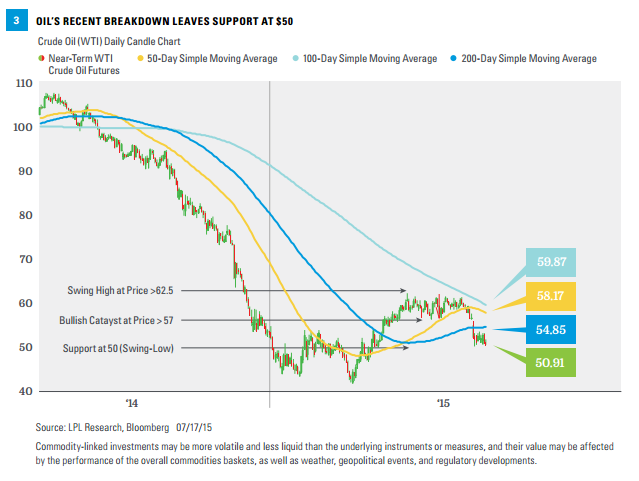
Technical analysis of oil price trends reveals another concern. Oil’s decline last week puts the next support level at $50 [Figure 3]. Should oil prices reverse higher, key levels to watch would be the 100-day moving average at about $55, followed by the top end of the previous range in the $61-62 area. The recent oil breakdown is concerning, as it not only puts a potential return to the $40s on the table technically, but it also makes a break into the mid- to high $60s potentially more difficult from a technical perspective. In addition, we expect continued drag from a strong U.S. dollar, which makes oil more expensive to global buyers and has historically exhibited inverse correlation with oil prices. From a technical perspective, oil’s range may be between $50 and low $60s, similar to our estimated range of fair value based on fundamentals of supply and demand.

CONCLUSION
The additional supply expected from Iran and the slow response by producers to reduce supply may lengthen oil’s stay in the $50-60 range. Several fundamental factors may support oil prices above a potential floor of $50, but supply and technical headwinds exist that may limit oil’s near-term upside potential above $60. As a result, in the near term we have tempered our enthusiasm for the energy sector, and at current oil price levels view it as a market performer.
IMPORTANT DISCLOSURES
The opinions voiced in this material are for general information only and are not intended to provide specific advice or recommendations for any individual. To determine which investment(s) may be appropriate for you, consult your financial advisor prior to investing. All performance referenced is historical and is no guarantee of future results.
The economic forecasts set forth in the presentation may not develop as predicted and there can be no guarantee that strategies promoted will be successful.
Investing in stock includes numerous specific risks including: the fluctuation of dividend, loss of principal, and potential liquidity of the investment in a falling market.
Investing in foreign and emerging markets securities involves special additional risks. These risks include, but are not limited to, currency risk, geopolitical risk, and risk associated with varying accounting standards. Investing in emerging markets may accentuate these risks.
Currency risk is a form of risk that arises from the change in price of one currency against another. Whenever investors or companies have assets or business operations across national borders, they face currency risk if their positions are not hedged.
Technical Analysis is a methodology for evaluating securities based on statistics generated by market activity, such as past prices, volume and momentum. Technical analysts do not attempt to measure a security’s intrinsic value, but instead use charts and other tools to identify patterns and trends. Technical analysis carries inherent risk, chief amongst which is that past performance is not indicative of future results.
DEFINITIONS
A simple moving average (SMA) is a simple, or arithmetic, moving average that is calculated by adding the closing price of the security for a number of time periods and then dividing this total by the number of time periods. Short-term averages respond quickly to changes in the price of the underlying, while long-term averages are slow to react.
A candle chart displays the high, low, opening, and closing prices for a security for a single day. The wide part of the candlestick is called the “real body” and tells investors whether the closing price was higher or lower than the opening price (black/red if the stock closed lower, white/green if the stock closed higher). The candlestick’s shadows show the day’s high and lows and how they compare to the open and close. A candlestick’s shape varies based on the relationship between the day’s high, low, opening and closing prices.
Swing high is a term used in technical analysis that refers to the peak reached by an indicator or an asset’s price. A swing high is formed when the high of a price is greater than a given number of highs positioned around it. A series of consecutively higher swing highs indicates that the given asset is in an uptrend.
This research material has been prepared by LPL Financial.
To the extent you are receiving investment advice from a separately registered independent investment advisor, please note that LPL Financial is not an affiliate of and makes no representation with respect to such entity.
Not FDIC or NCUA/NCUSIF Insured | No Bank or Credit Union Guarantee | May Lose Value | Not Guaranteed by Any Government Agency | Not a Bank/Credit Union Deposit
Tracking #1-402255 (Exp. 07/16)
