
KEY TAKEAWAYS
- As companies report second quarter 2015 results, the health of the global economy will likely get plenty of attention.
- The U.S., China, the Eurozone, and Japan account for nearly two-thirds of global economic activity; thus, these areas are where global growth matters the most.
- The market continues to expect that global GDP growth will accelerate in 2015, 2016, and 2017, aided by lower oil prices and stimulus from two of the three leading central banks in the world.
Click here to download a PDF of this report.
GAUGING GLOBAL GROWTH: AN UPDATE FOR 2015 & 2016
The market continues to expect that global gross domestic product (GDP) growth will accelerate in 2015, 2016, and 2017, aided by lower oil prices and stimulus from two of the three leading central banks in the world. The prospect for another year of decelerating growth in emerging markets remains a concern for some investors, who may still be waiting (in vain) for China to post 10-12% growth rates as it consistently did during the early to mid-2000s. The likelihood of rate hikes in the U.S. in late 2015 and the U.K. in early 2016 is also a potential growth headwind. Still, much stimulus remains in the system, and more is likely from the Bank of Japan (BOJ) and the European Central Bank (ECB), which may help bolster growth prospects in two key areas of the globe. Although China is unlikely to embark on quantitative easing (QE), Chinese authorities have recently enacted a series of targeted fiscal, monetary, and administrative actions aimed at stabilizing China’s economy in 2015 and beyond, and more such actions may follow.
WHY GLOBAL GDP GROWTH MATTERS
The outlook for global growth matters to investors because it defines the ultimate pace of activity that creates value for countries, companies, and consumers. As investors begin to digest the S&P 500 earnings reports for the second quarter of 2015 (more than 40 S&P 500 companies will report second quarter results this week, with another 300 set to report in the final two weeks of July), we provide an update on how consensus estimates for economic growth for 2015 and 2016–in the United States and worldwide–have evolved over the past few years, and how they have been impacted by Greece, China, oil prices, the stronger dollar, and Federal Reserve (Fed) expectations. We’ll also look at how global growth estimates are tracking for 2017.
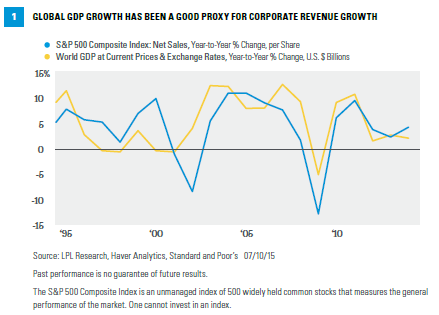
In recent years markets have focused more on global GDP growth, whereas in the past, prospects for U.S. economic growth garnered the most attention from market participants. Why does global GDP growth matter? As we have noted in prior Weekly Economic Commentaries, financial markets–especially equity markets–focus intently on earnings. Broadly speaking, earnings growth is driven by “top-line” growth, or revenue growth, less the costs incurred earning that revenue, with labor accounting for more than two-thirds of total costs. A good proxy for global revenue growth is global GDP growth plus inflation. Thus, the pace of growth in the global economy is a key driver of global earnings growth, and ultimately, the performance of global equity markets [Figure 1]. As we note in the July 13, 2015, edition of the Weekly Market Commentary, “Q2 Earnings Preview,” the market expects that S&P 500 companies will post a 3% drop in earnings growth in the second quarter of 2015 versus the second quarter of 2014. The expected decline is primarily driven by the stronger U.S. dollar and the decline in oil prices; however, we expect more than a handful of firms may cite global growth concerns (mainly in Europe and China) as they discuss second quarter results and provide guidance for the rest of 2015 and beyond.
GROWTH ESTIMATES ARE ALMOST ALWAYS REVISED LOWER
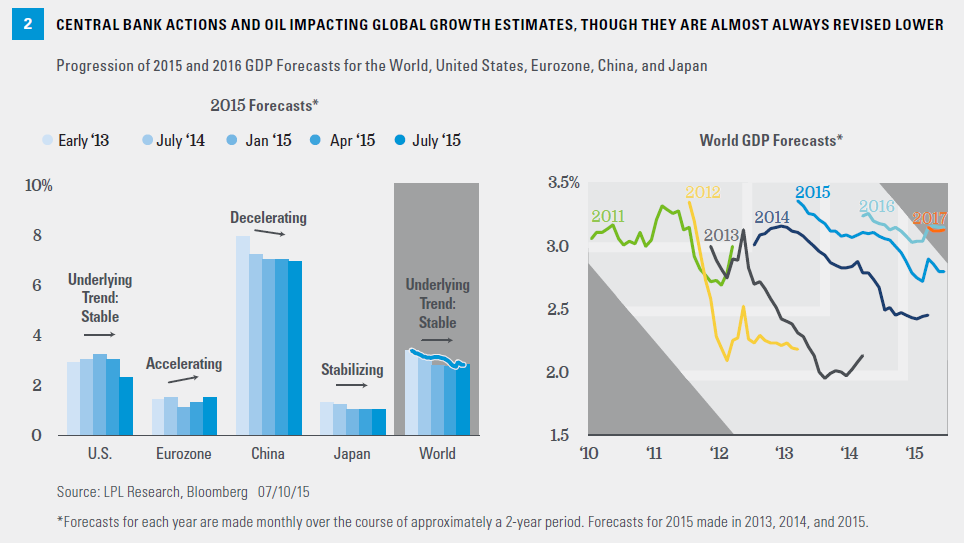
Figure 2 details the progression of the consensus GDP forecasts for 2015 for the world, the United States, China, the Eurozone, and Japan over the past several years. It also presents the changes over the past five years in the Bloomberg consensus estimate for global GDP for each year from 2011 through 2017, as an extension of the “world” bar. In short, the widespread and frequent reports in the media–most often cited by bearish investors–that “global growth has been revised downward” are technically correct, but miss the point that global growth estimates are almost always revised lower. Despite this pattern of revising GDP growth estimates lower, the global economy has been in recovery since 2009, and global equity prices–as measured by the MSCI World Index–are up 181% since March 2009, and have posted gains in five of the six calendars years from 2009 through 2014. Year to date through July 10, 2015, the MSCI World Equity Index is up 2%.
The latest (mid-July 2015) Bloomberg-tracked economists’ consensus forecast for 2015 global GDP growth stands at 2.8%, up from the 2.7% expected three months ago in April 2015 and unchanged from where estimates for 2015 global GDP growth stood at the start of 2015. A year ago, in early 2014, the consensus expected 3.1% growth in 2015; and in early 2013, when Bloomberg first began tracking consensus estimates for global GDP growth for 2015, the consensus expected 3.4% world GDP growth. The downward revisions to 2015 global growth estimates are nothing new [Figure 1]. Consensus estimates for global GDP growth have been consistently revised lower since at least 2010.
Consensus estimates for global growth in 2016–which stood at 3.2% in July 2015–have also been moving lower since the start of 2015 (3.2%) and since 2016 estimates were first compiled by Bloomberg in early 2014 (3.3%). Here again, this should neither surprise nor concern global investors, as global growth estimates are almost always revised lower over time. Looking out to 2017, global growth estimates have remained steady at 3.2% since Bloomberg began tracking consensus estimates for 2017 in early 2015.
SEVERAL FACTORS ARE CONTRIBUTING TO REGIONAL DIFFERENCES IN GROWTH ESTIMATES
The U.S., China, the Eurozone, and Japan account for nearly two-thirds of global economic activity. So while there have been major upward revisions to GDP growth estimates for 2015 and 2016 in places like India and Poland, major downward revisions to 2015 and 2016 growth estimates in Russia and Brazil were offsets to overall global growth estimates. On balance, it is growth in the U.S., China, the Eurozone, and Japan that matters most.
U.S.: Tracking to above-consensus 3.0%+ growth.Estimates for U.S. GDP growth for 2015 stand at 2.3% at midyear, down from 3.2% at the start of the year and from the 3.0% forecast a year ago, in July 2014. The drop in oil prices, the stronger dollar, and probably most significantly, the poor start to 2015 (due to bad weather and the West Coast port strikes) account for most of the decline. The consensus estimate for 2016 (at 2.8%) hasn’t moved much in the past year, and the consensus is looking for a 2.7% growth rate in 2017. As we noted in our Midyear Outlook 2015: Some Assembly Required publication, we continue to expect 3.0%+ GDP growth over the final three quarters of 2015.*
*As noted in the Outlook 2015, LPL Research expects GDP to expand at a rate of 3% or higher, which matches the average growth rate of the past 50 years. This is based on contributions from consumer spending, business capital spending, and housing, which are poised to advance at historically average or better growth rates in 2015. Net exports and the government sector should trail behind.
China: Struggling with transition to consumer economy.The consensus expects 7% GDP growth in China this year and 6.5-7% growth in 2016 and 2017, and like global growth estimates, the consensus estimates for Chinese economic growth have been moving lower for years. All else being equal, the recent drop in oil and commodity prices should have been a net positive for China’s growth prospects, but Chinese authorities have continued to struggle to implement the correct mix of monetary, fiscal, and regulatory policy to help guide China’s economy from an export-led manufacturing economy to a more domestically oriented consumer economy. Over the past few years, China’s property bubble gave way to a property price bust, and some of that “hot” money went into Chinese domestic equities, which soared by more than 160% between mid-2014 and mid-2015, before dropping 30% between early June and early July 2015.
In our view, the 30% drop in Chinese equities over the past month does not represent any new information about China’s fundamentals any more than the 160% gain between mid-2014 and mid-2015 did. In fact, the 160% gain in Chinese stocks in 2014 and early 2015 was accompanied by generally deteriorating fundamentals for the Chinese economy and many Chinese companies. While we don’t think the large fall in Chinese equity prices over the past month foreshadows another leg down in the Chinese economy, it does distract Chinese officials from their stated goal of shifting the focus of China’s economy. Market consensus expects a 7% year-over-year reading for China’s Q2 GDP (due out this week), and are well aware that China’s property bubble has burst and that the Chinese economy is no longer growing at 10-12%.
Eurozone: Improving global growth prospects despite Greece concerns. Despite the never-ending discussions about Greece and its place in the Eurozone, and bucking the usual trend of downward revisions to growth over time, GDP growth prospects in the Eurozone have been revised higher for 2015 and 2016 since the start of 2015. Actions by the ECB to enact QE earlier this year, which, in turn, helped to heal Europe’s fractured banking system, have contributed to positive growth prospects in Europe. Europe is also benefiting from lower oil prices, and a quick resolution of the latest issues in Greece may provide a confidence boost. At midyear 2015, the consensus expects 1.5% GDP growth in the Eurozone in 2015, accelerating to 1.7% in 2016.
Japan: Adding to global growth consistently. The BOJ is in a “wait and see” mode after enacting QE in early 2013, increasing the size of the QE program in late 2014, and has promised to do more if GDP growth in Japan falters or if deflation in Japan persists. Consensus GDP estimates for Japan in 2015 stand at 1.0% at midyear 2015, unchanged from the estimates made at the start of 2015. Growth estimates for 2016 have been revised significantly higher over the past year, and now stand at +1.4%, up from 1.1% at the start of 2015 and 0.8% a year ago. While deteriorating demographics and large public debt levels will continue to weigh on Japanese growth in the coming years and decades, Japan is now consistently adding to global growth prospects for the first time in many years.
THE WEEK AHEAD
Global growth will likely be a recurring theme for investors this week. The health of the global economy and key regions (U.S., Japan, and especially the Eurozone and China) will likely receive plenty of attention from corporate managements as they discuss second quarter 2015 results and provide guidance for the rest of 2015. In the U.S., the Fed’s latest Beige Book–a qualitative assessment of consumer, business, and banking conditions on Main Street–will provide insight into the U.S. economy when it is released on Wednesday, July 15, 2015. In addition, market participants are still likely to be reacting to the summer 2015 update of the International Monetary Fund’s (IMF) widely read World Economic Outlook, which was released on Thursday, July 9. China will release its Q2 2015 GDP data on Wednesday, July 15.
IMPORTANT DISCLOSURES
The opinions voiced in this material are for general information only and are not intended to provide specific advice or recommendations for any individual. To determine which investment(s) may be appropriate for you, consult your financial advisor prior to investing. All performance referenced is historical and is no guarantee of future results. All indexes are unmanaged and cannot be invested into directly.
The economic forecasts set forth in the presentation may not develop as predicted.
Investing in stock includes numerous specific risks including: the fluctuation of dividend, loss of principal and potential illiquidity of the investment in a falling market.
Investing in foreign and emerging markets securities involves special additional risks. These risks include, but are not limited to, currency risk, geopolitical risk, and risk associated with varying accounting standards. Investing in emerging markets may accentuate these risks.
Commodity-linked investments may be more volatile and less liquid than the underlying instruments or measures, and their value may be affected by the performance of the overall commodities baskets as well as weather, geopolitical events, and regulatory developments.
INDEX DEFINITIONS
The MSCI World Index represents large and mid-cap equity performance across 23 developed markets countries, covering approximately 85% of the free float-adjusted market capitalization in each. This index offers a broad global equity benchmark, without emerging markets exposure.
The S&P 500 Index is a capitalization-weighted index of 500 stocks designed to measure performance of the broad domestic economy through changes in the aggregate market value of 500 stocks representing all major industries.
This research material has been prepared by LPL Financial.
To the extent you are receiving investment advice from a separately registered independent investment advisor, please note that LPL Financial is not an affiliate of and makes no representation with respect to such entity.
Not FDIC or NCUA/NCUSIF Insured | No Bank or Credit Union Guarantee | May Lose Value | Not Guaranteed by Any Government Agency | Not a Bank/Credit Union Deposit
Tracking #1-400257 (Exp. 07/16)