
KEY TAKEAWAYS
- Municipal supply has been a headwind for much of 2015 but appears to be tapering off ahead of a typical summer slowdown.
- Over the longer term, still tight state budgets may keep broader municipal supply restrained and limit growth of the overall municipal bond market, which could become a tailwind.
- Despite the constant flow of negative headlines, primarily from Puerto Rico, the overall credit quality of the municipal market appears to be on solid footing.
Click here to download a PDF of this report.
STATE OF THE STATES
July 1 is the beginning of the fiscal year for 46 of 50 states and the ability of states to get budgets approved is imperative, as a delay could impair states’ abilities to make timely interest and principal payments on their debt obligations.
SUPPLY AND DEMAND
Municipal supply has been a headwind for much of 2015 but appears to be tapering off ahead of a typical summer slowdown. New issuance, as measured by The Bond Buyer’s30-day visible supply calendar, has run well ahead of the average pace of the prior five years [Figure 1]. As Figure 1 also illustrates, supply is slowing earlier, compared with a seasonal slowdown that typically begins at the start of July.
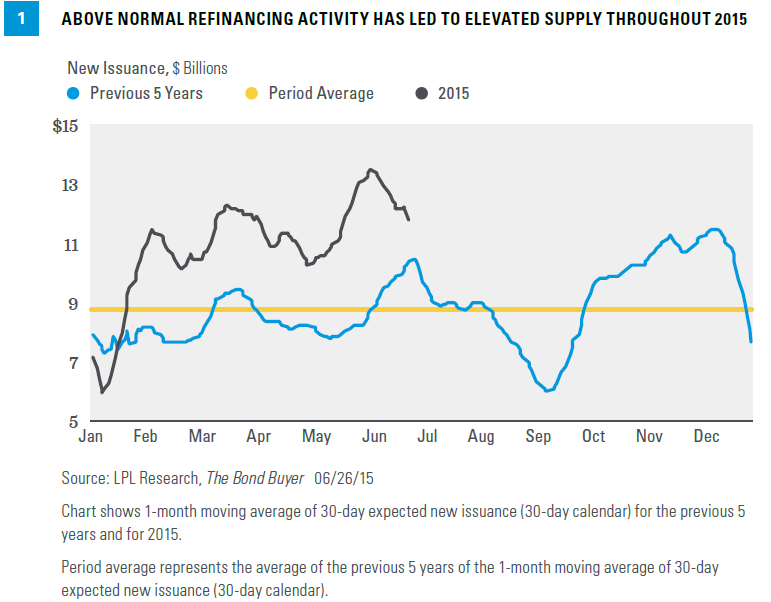
On a positive note, the bulk of new issuance in 2015 has been due to refinancing, as governments take advantage of lower market interest rates. Now, higher interest rates should slow refinancing activity, if it has not already done so.
Supply is also likely to be limited as state budgets are still under stress. State revenue has increased steadily since 2010, but at a slower pace than expenditures. State tax revenue has recovered at the slowest pace following any recession over the last 50 years. Therefore, capacity to take on new debt may still be limited. Over the longer term, still tight state budgets may keep broader municipal supply restrained and limit growth of the overall municipal bond market. This could potentially become a tailwind for investors as demand remains elevated relative to supply.
STATE AUSTERITY
The term “austerity” is linked to Europe, but the positive, albeit slow, recovery in state revenue has led to a mild version of state austerity. Per Moody’s, the overall state debt backed by taxes, which does not include local government debt or specific revenue projects, actually fell in 2014 for the first time in 28 years. Moody’s prediction is for state debt levels to stay flat in 2015 but potentially rise over the long term, as overdue infrastructure spending will be necessary in light of little assistance from the federal government.
The American Society of Civil Engineers estimates that approximately $3.6 trillion in infrastructure repairs will be necessary by 2020. The figure shows that state and local governments have been forgoing road and bridge maintenance for years, while recouping the damage done to revenue during the Great Recession.
Pension obligations continue to pose a long-term threat to state budgets but pension funding has improved recently. A study by Boston College’s Center for Retirement Research showed that from 2013 to 2014, pension funding levels and the payment of required contributions both increased. One driver of modest pension funding improvement has been stock market gains. Higher state tax revenue–comprised primarily of income, corporate, and sales taxes–has also helped. However, the slow recovery in corporate taxes means that states must remain conservative. Over the long term, potentially with a less accommodating stock market, the burden of pension obligations may lead to tax hikes, such as those being considered by Pennsylvania, Chicago, and Illinois. Though a potential negative for economic growth, increasing taxes could enhance the allure of tax-advantaged municipal bonds.
PROBLEM ISSUERS STILL ISOLATED
Puerto Rico’s government has been unable to agree on a fiscal 2016 budget, which is needed to obtain short-term funding. Without it, Puerto Rico will likely default on some or most of its debt obligations. A Puerto Rico default has been more a question of when (not if) and of how many issuers would be impacted. At this point, the broader municipal market has treated Puerto Rico as an isolated event; but the threat of forced liquidations, although limited, could adversely impact the broader muni markets should liquidations, if any, become disorderly. Puerto Rican bonds have been deeply discounted for some time and we believe the declines over the last two trading days largely price in a high probability of default.
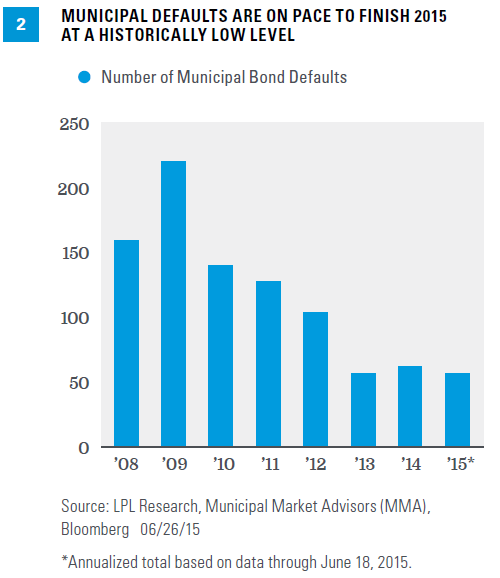
Despite the constant flow of negative headlines, most recently from Chicago, the state of Illinois, and Puerto Rico, the overall credit quality of the municipal market appears to be on solid footing. The number of municipal defaults is on pace to finish 2015 at a historically low level [Figure 2].
Though still above their 20-year averages, average AAA municipal-to-Treasury ratios fell in June, indicating that municipal valuations have richened steadily over the month [Figure 3].
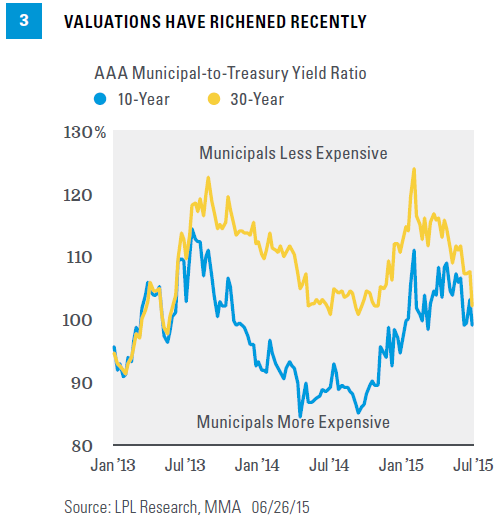
The improvement in 30-year valuations has been more pronounced than that of 10-year valuations. Despite richening, the 10-year AAA municipal-to-Treasury ratio is about 100%, above where it was for much of 2014. The same can no longer be said for the 30-year ratio, suggesting more caution may be warranted on the long end of the municipal curve. Intermediate municipals may provide better value currently, in addition to less interest rate sensitivity, and may provide a favorable risk-return trade-off relative to longer-dated municipals.
With the number of defaults low from a historical context, the municipal market may be in a good place to enjoy the tailwind of limited supply through 2015-2016. We find municipals to be one of the more attractive options among high-quality bonds, in what will likely continue to be a low-return environment. Over the near term, declining supply and favorable summer seasonality may provide a further tailwind, as July and August are historically two of the best performing months for municipal bonds, as the market benefits from the drop off in supply.
IMPORTANT DISCLOSURES
The opinions voiced in this material are for general information only and are not intended to provide specific advice or recommendations for any individual. To determine which investment(s) may be appropriate for you, consult your financial advisor prior to investing. All performance referenced is historical and is no guarantee of future results.
The economic forecasts set forth in the presentation may not develop as predicted and there can be no guarantee that strategies promoted will be successful.
Bonds are subject to market and interest rate risk if sold prior to maturity. Bond values and yields will decline as interest rates rise, and bonds are subject to availability and change in price.
Government bonds and Treasury bills are guaranteed by the U.S. government as to the timely payment of principal and interest and, if held to maturity, offer a fixed rate of return and fixed principal value. However, the value of fund shares is not guaranteed and will fluctuate.
Municipal bonds are subject to availability, price, and to market and interest rate risk if sold prior to maturity. Bond values will decline as interest rate rise. Interest income may be subject to the alternative minimum tax. Federally tax-free but other state and local taxes may apply.
Because of its narrow focus, specialty sector investing, such as healthcare, financials, or energy, will be subject to greater volatility than investing more broadly across many sectors and companies.
Moody’s Inc. is an independent, unaffiliated research company that rates fixed income securities. Moody’s assigns ratings on the basis of risk and the borrower’s ability to make interest payments. Moody’s backs its ratings with exhaustive financial research and unbiased commentary and analysis.
Different agencies employ different rating scales for credit quality. Standard & Poor’s (S&P) and Fitch both use scales from AAA (highest) through AA, A, BBB, BB, B, CCC, CC, C to D (lowest). Moody’s uses a scale from Aaa (highest) through Aa, A, Baa, Ba, B, Caa, Ca to C (lowest).
This research material has been prepared by LPL Financial.
To the extent you are receiving investment advice from a separately registered independent investment advisor, please note that LPL Financial is not an affiliate of and makes no representation with respect to such entity.
Not FDIC or NCUA/NCUSIF Insured | No Bank or Credit Union Guarantee | May Lose Value | Not Guaranteed by Any Government Agency | Not a Bank/Credit Union Deposit
Tracking #1-396770 (Exp. 06/16)