
KEY TAKEAWAYS
- We do not believe transports’ weakness is a signal of an impending economic and market downturn.
- Historical data suggest transports’ underperformance may actually be signaling a buying opportunity for the S&P 500 rather than a sell.
- We believe transports present an attractive investment opportunity for the second half of 2015.
Click here to download a PDF of this report.
DEBUNKING DOW THEORY
Transports have lagged the broad market so far this year, causing many to wonder if that signals an impending economic and market downturn. We do not think so, and our claim is supported by the historical data. As we discuss transports’ efficacy as a leading indicator (so called “Dow Theory”), we provide analysis showing that transports’ weakness in recent decades has actually been a better buy signal for the stock market than a sell signal, and we reiterate our positive view of the industry.
While the situation in Greece is uncertain and very fluid, we do not expect a potential breakup of the Eurozone to cause a recession or bear market in the United States, and we would be looking for opportunities to buy transports stocks–or stocks in general–on significant weakness, should it occur.
WHAT IS DOW THEORY?
Concern that weakness in transportation stocks (transports) might be a warning for the broader markets comes from Dow Theory, one of the oldest applications of technical analysis. First developed more than 100 years ago by Charles Dow, founder of The Wall Street Journal,and refined by others, Dow developed two averages to measure stock market performance that eventually became today’s Dow Jones Industrial and Transportation Averages.
During the Industrial Revolution, these averages provided a good representation of the economy. Today, if you want confirmation of a trend reversal for the broad S&P 500 Index that gives you a more representative picture of the U.S. economy, you would not necessarily look to transports, which play a smaller role in the current more service-based and technology-driven U.S. economy than they did in Dow’s day. You might instead look to the Nasdaq Composite, which represents the increasingly important “good old American know-how” sector of the U.S. economy (see our May 11, 2015, Weekly Economic Commentary, “Watching Wages” and Midyear Outlook 2015: Some Assembly Required). The Nasdaq, in fact, has been a good technical tool to identify changing market trends in recent decades. You might also look for broader confirmation and include the entire industrials sector and small caps.
Dow did speculate that railroads would likely lead industrials, since rail activity can show demand for the raw materials needed to drive a manufacturing economy. But in today’s economy, we think the Institute for Supply Management’s (ISM) Purchasing Managers’ Index (PMI) offers a better indicator, because purchasing managers serve as bellwethers for changing demand for manufacturing inputs (and are not subject to fickle shifts in market sentiment). For this reason, the ISM’s PMI is one of LPL Research’s favorite early indicators of potential changes in earnings trends and one of our Five Forecasters, as cited in our Midyear Outlook 2015, which we believe collectively can provide useful warning signals of an impending economic and market downturn.
IS TRANSPORTS’ WEAKNESS A MARKET SIGNAL?
Transports have had a rough start to 2015. Year to date, the S&P 500 Transports Index is down about 14%, compared with the 2% advance for the S&P 500 Index [Figure 1]. The industry’s weakness has sparked the question of whether this deteriorating performance is a signal of an impending economic and market downturn.
![]()
To answer this question, we analyzed prior periods in which the transports industry, represented by the Dow Jones Transportation Index, underperformed the Dow Jones Industrial Index by 10 percentage points or more (year to date the Dow Jones Transportation Index has underperformed the Dow Jones Industrial Index by approximately 10%). We use the Dow Transports because the index has a longer history (the S&P 500 Transportation Index was created in 1995) and to be consistent with Dow Theory, but we get similar results when using the S&P 500 industry data over the past 20 years. We test this signal against the S&P 500 Index, which better represents the broad market.
Looking back at historical price data to 1975, Dow Transports Index underperformance has not signaled stock market corrections. In fact, we have seen the opposite. Over the past 40 years, the Dow Transports Index has underperformed the Dow Industrials Index by 10% or more 11 different times. After the relative “loss” reached the 10% threshold, over the next 6 months, the S&P 500 rose by an average of 13%, and was higher 10 out of 11 times. Over the next 12 months, the S&P 500 rose by an average of 18.5%, and was also higher 10 out of 11 times. The data clearly show that transports’ weakness is far from a reliable signal of impending market weakness. In fact, if anything, it could be considered a contrarian buy signal. The data for the last 8 instances, with performance 3, 6, and 12 months after the big underperformance, are shown in Figure 2.
![]()
WE STILL LIKE THE TRANSPORTS INDUSTRY
Beyond the evidence above, which suggests a transports turnaround, we like the industry for several other reasons:
Economic snapback. Fewer weather disruptions and the resolution of the port strikes have helped the economy pick up some speed during the second quarter. Meanwhile, although the strong U.S. dollar remains a drag on both U.S. exports and earnings derived overseas, better economic growth in Europe and Japan are benefiting the global growth picture, which we expect to drive more demand for transportation services over the rest of the year. U.S. gross domestic product (GDP) growth is tracking to near 3% for the nearly completed second quarter.
Energy cost savings. Transports are both helped and hurt by lower commodity prices, but we think the benefits outweigh the costs. In the Weekly Market Commentary,“The Bright Side of Cheap Oil” (January 12, 2015), we noted that fuel represents about one-third of airline industry costs (20% of the S&P 500 Transportation Index), about 20% for rails (45% of the index), and nearly 10% for the big shippers (10-15% of the index). Contrast that with the fact that only 3-4% of rail traffic is petroleum related (including fracking sand), and you can see that lower fuel costs, even with some fuel hedging activity, more than outweigh the reduced oil exploration due to lower oil prices.
The bigger problem–though one that we think the rails can overcome–is coal, which represents 17% of U.S. rail traffic and is seeing double-digit annual volume declines. The regulatory environment for coal will not get easier anytime soon, but natural gas (coal’s primary competitor as a power generator) has stabilized and prices are starting to move higher, which may help improve the outlook for coal demand.
Airline industry discipline. Airlines have long had a reputation for a lack of financial discipline and their history is littered with bankruptcies. Many airlines have overexpanded ahead of recessions and engaged in financially damaging price wars. But the group’s prospects are very different today. In addition to the cost benefit form cheap fuel, the financial crisis provided a catalyst for the industry to become more efficient, lower operating costs, and boost margins. Industry consolidation has helped improve capacity and pricing discipline. And new fees have driven additional revenue. We do not believe the market is giving this group enough credit for these positives.
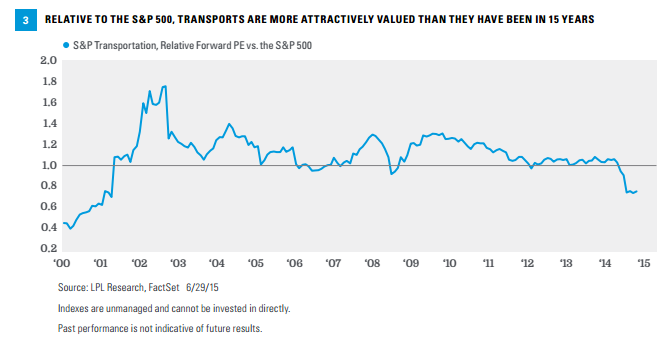
Attractive valuations. The decline in transports this year has left valuations very attractive. In fact, based on the forward price-to-earnings ratio (PE) relative to the S&P 500, the group is the cheapest it has been in 15 years [Figure 3]. We would argue you have to go back 20 years (1995 - 1996) to find a period when transports were cheaper on a relative basis, given that relative valuations during the internet bubble were skewed by excessive technology valuations (everything non-tech looked cheap in comparison). Given the group’s earnings growth outlook–consensus is calling for a more than 30% increase in earnings growth from the S&P 500 Transportation Index in 2015–we find transports’ valuations compelling.
CONCLUSION
Don’t be scared out of the stock market by Dow Theory. The historical data suggest the transports’ underperformance may actually be signaling a buying opportunity for the S&P 500 rather than a sell. We find other leading indicators in today’s economy to be more effective signals of market downturns, and they continue to suggest–despite the crisis in Greece–that the bull market and economic expansion are set to continue through 2015 and beyond.
We believe transports present an attractive investment opportunity for the second half of 2015, given the unfolding snapback in the U.S. economy, still low energy costs, the improved positioning of the airline industry, and attractive valuations. Greece-related weakness may present an even more attractive buying opportunity for this group. Potential declines in commodity shipments, including crude oil and coal, are a risk, as is Europe, but we believe much of this risk is sufficiently discounted in valuations at this point.
IMPORTANT DISCLOSURES
The opinions voiced in this material are for general information only and are not intended to provide specific advice or recommendations for any individual. To determine which investment(s) may be appropriate for you, consult your financial advisor prior to investing. All performance referenced is historical and is no guarantee of future results.
The economic forecasts set forth in the presentation may not develop as predicted and there can be no guarantee that strategies promoted will be successful.
Price-to-earnings ratio is a valuation ratio of a company’s current share price compared to its per-share earnings.
All investing involves risk including loss of principal.
INDEX DESCRIPTIONS
The Standard & Poor’s 500 Index is a capitalization-weighted index of 500 stocks designed to measure performance of the broad domestic economy through changes in the aggregate market value of 500 stocks representing all major industries.
The Institute for Supply Management (ISM) Index is based on surveys of more than 300 manufacturing firms by the Institute of Supply Management. The ISM Manufacturing Index monitors employment, production inventories, new orders, and supplier deliveries. A composite diffusion index is created that monitors conditions in national manufacturing based on the data from these surveys.
The Dow Jones Industrial Average is a price-weighted average of 30 significant stocks traded on the New York Stock Exchange and the Nasdaq.
This research material has been prepared by LPL Financial.
To the extent you are receiving investment advice from a separately registered independent investment advisor, please note that LPL Financial is not an affiliate of and makes no representation with respect to such entity.
Not FDIC or NCUA/NCUSIF Insured | No Bank or Credit Union Guarantee | May Lose Value | Not Guaranteed by Any Government Agency | Not a Bank/Credit Union Deposit
Tracking #1-396232 (Exp. 06/16)